
Photo by Kenrick Baksh on Unsplash
In this post I will analyze OECD International Student Mobility data using R.
You can download data from
Students - International student mobility - OECD Data
CSV file image is below.
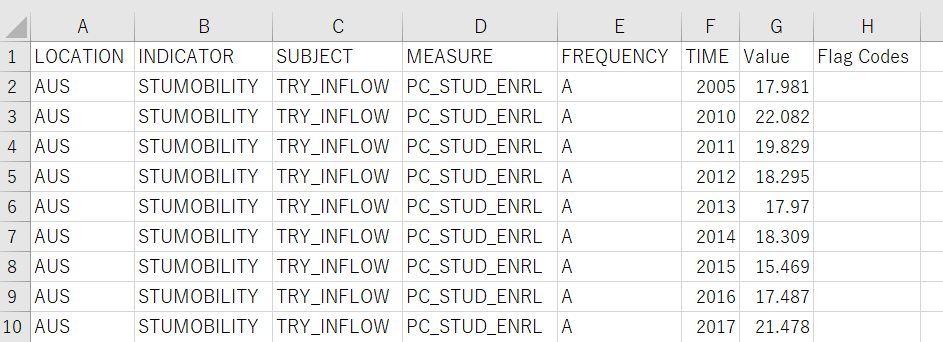
Let's upload this data into R.
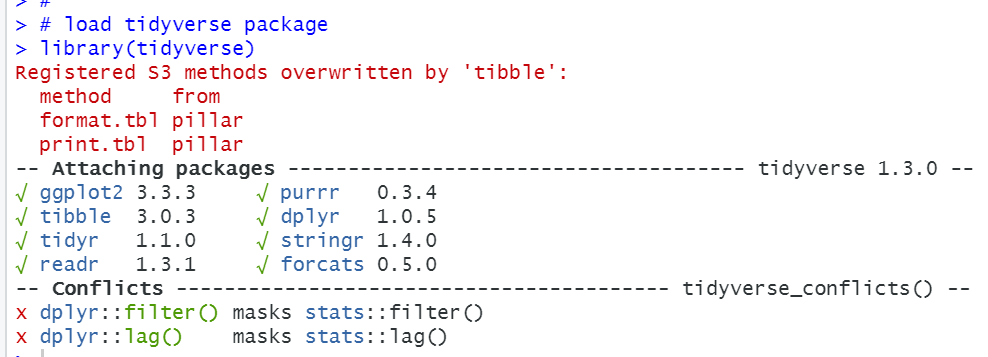
To begin with, load tidyverse package.
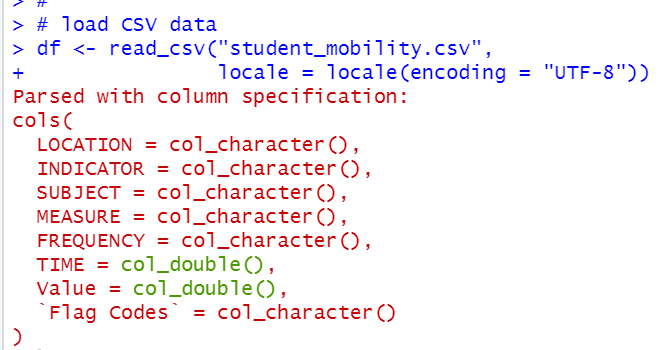
Then, use read_csv() function to load CSV file data.
Let's see each variables. I use table() function for character bariables and summary() function for numeric variables.
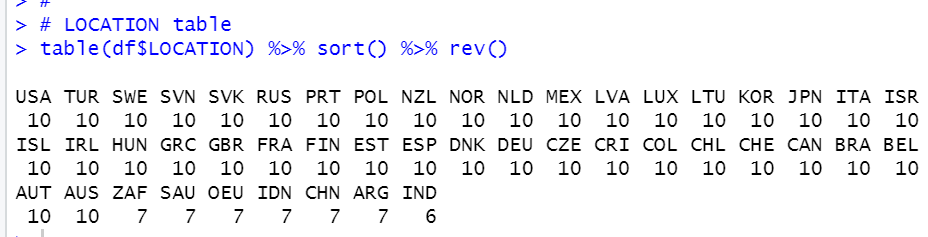
Many countries have 10 observations.
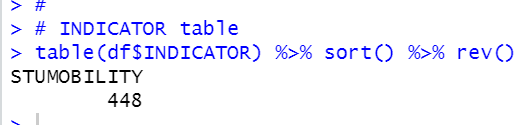
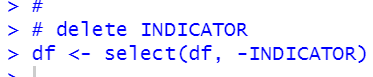
For INDICATOR, we have only one "STUMOBILITY", so we can delete it from df.
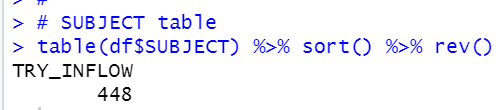
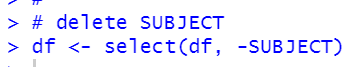
For SUBJECT, we have only one "TRY_INFLOW", so we can delete it too.
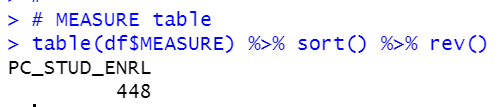
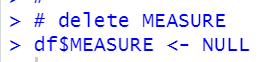
For MEASURE, we have only one "PC_STUD_ENRL", so we can delete it too.
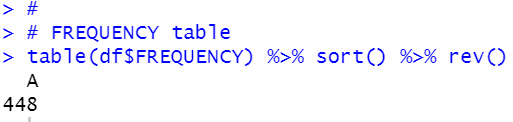
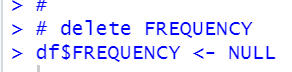
For FREQUENCY, we have only "A", so we can delete it too.
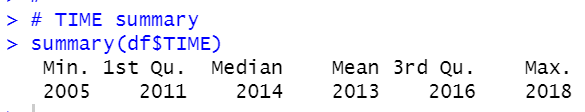
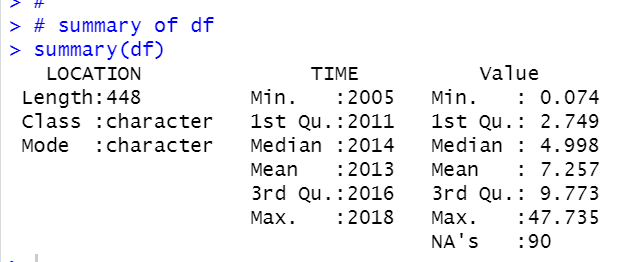
For TIME, the oldest year is 2005, the newest year is 2018 and we don't have NA.
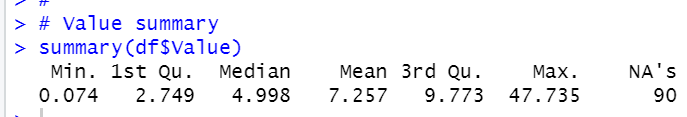
Value is International Student Mobility, so it is the most important data in the data frame.
The lowest value is 0.074 and the highest value is 47.735. It means there is a country which tertially strudend is almost half from abroad. We have 90 NAs.
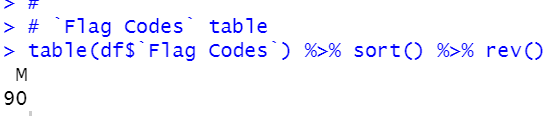
For Flag Codes, we have only "M", so we can delete it too,
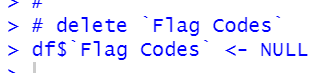
Now, we delete vatiables which have only one kind of observations.
Let's look at whole data frame summary.
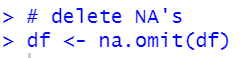
We have 90 NA's for Value, so, let's delete them.
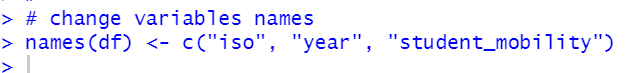
I change variable names.
Now, let's see summary again.
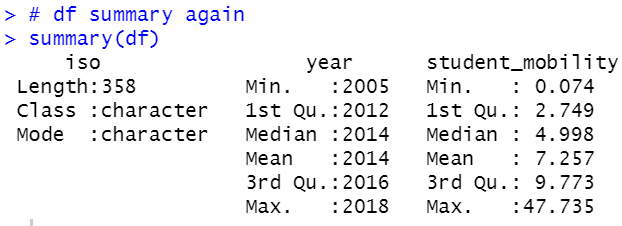
All right, we have prepared for analysis so far.
That's it today. Thank you!
The next post,