Photo by Taun Stewart on Unsplash

I this series of posts, I will analysis OECD data, "Trust in governmet".
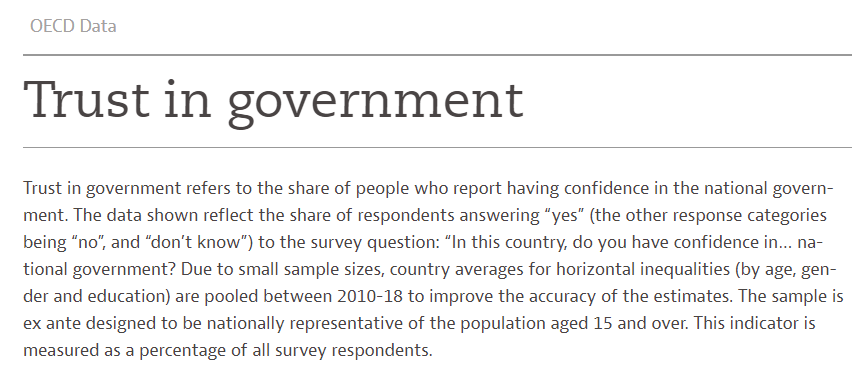
I got below CSV file from General government - Trust in government - OECD Data

I use R to analyze this data.
Firstly, I load tidyverse package.

Then, I use read_csv() function to load CSV data into R.

I copy df_raw to df so that I don't nead to use read_csv() again if I did mistake with the dataframe.
Let's check each vatiables.
LOCATION

LOCATION means ISO country code. We see max observation number is 15.
So, I will filter countries which has 15 observations.

Next variable is INDICATOR we check.

INDICATOR is only one value, TRUSTGOV, so I will delete it from the df.

Next, let's chack SUBJECT

I will delete SUBJECT too.

Next, let's see MEASURE.

I can delete MEASURE too because there is only one value; PC.

Then, let's see FREQUENCY

I will delete FREQUENCY

Let's see TIME

TIME means year. We have data from 2006 to 2020 for 21 LOCATIONS.
The last variable is value, it is percentage of trust in government.

The minimum trust percentage is only 6.877%! The average is 40.239% and the maximum is 71.580%.
That's it.
Thank you!
Next post is