
Photo by Jim Cooke on Unsplash
This post is following of the above post.
So far previous posts, GDP nor per capita GDP cannot explain Trust in governmnet very well. I will add more variables.
I have CPI, inflation data like below.
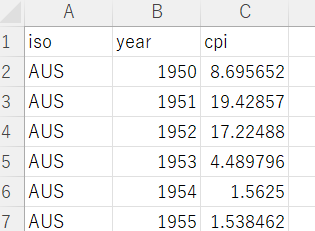
I got this data from OECD web site. cpi means infration rate.
Let's add this data.
Firstly, I use read_csv() fundtion to read the data.
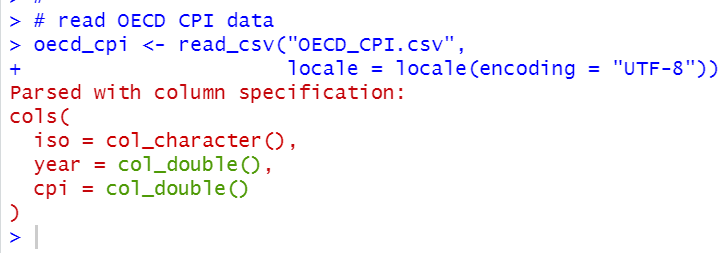
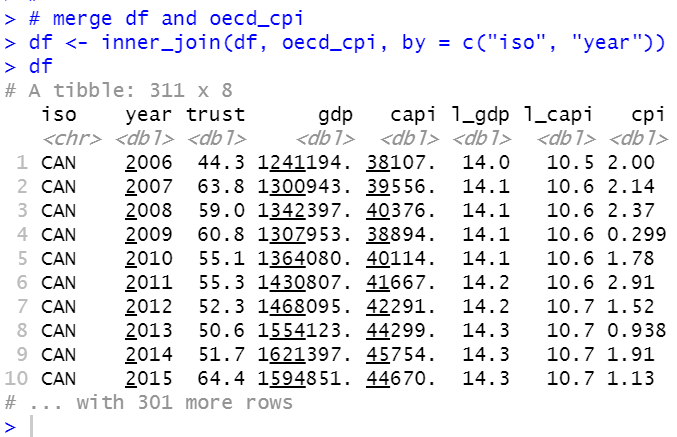
I use inner_join() function to merge dataframe "df" and dataframe "oecd_cpi".
Let's see correlation with trust, l_gdp, l_capi and cpi

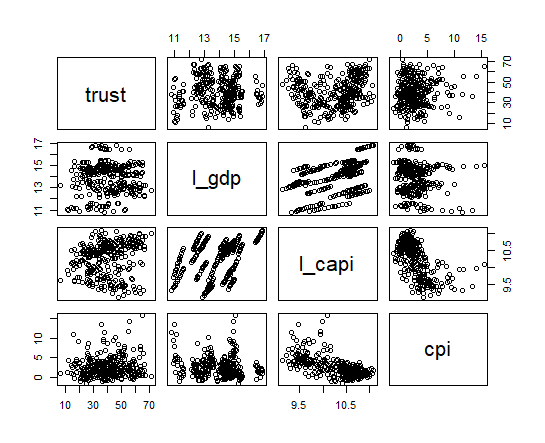
l_capi and cpi has -0.61 correlation. and it is the absolutely largest correlation.
Let's see scatter plots matrix.
Les's make a liear regression model. In this time, I select l_capi, cpi and iso for variables.
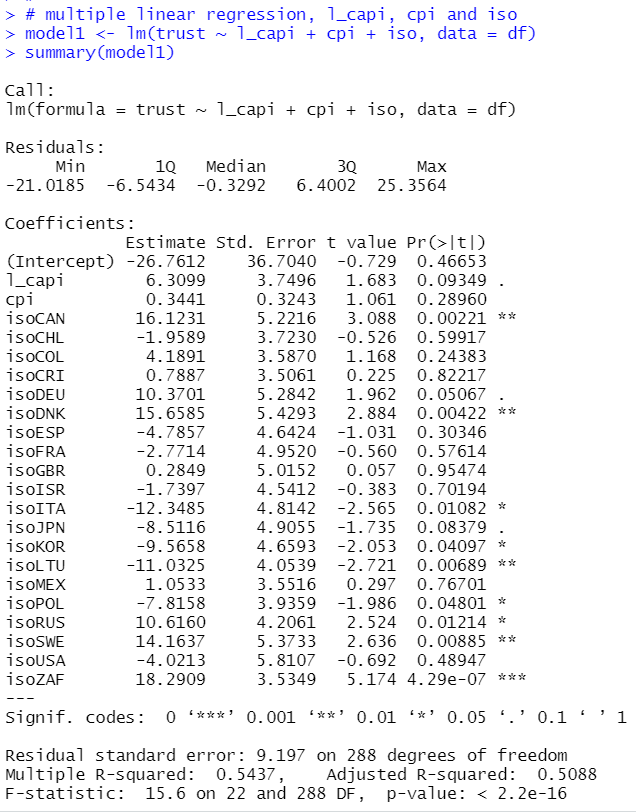
I see l_capi's coefficient is 6.3099 with p-value 0.093. So, l_capi is statistically significant at 10% level. If cpi(infration rate) is fixed, more l_capi(log(per capita GDP)) makes more trust in government. It is natual.
I see some iso(country) has significant coefficients. Let's see it.
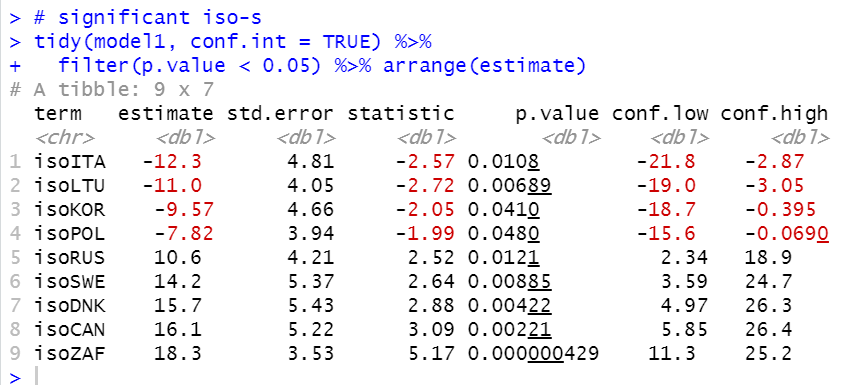
ITA, LTU, KOR and POL have statistically low Trust in government if l_capi and cpi are fixed.
RUS, SWE, DNK, CAN and ZAF have statistically high Trus in government if l_capi and cpi are fixed.
That's it. Thank you!
Next post is
To read the 1st post,