
Photo by Sunil Naik on Unsplash
This post is following of the above post.
I have another data file like below

This is GDP and per capita GDP data.
I will merge this data with trust in government data.
First, I load this file with read_csv() function.

Then, I use inner_join() function to merge df and gdp_file.
df$LOCATION and gdp_file$iso are same variable, df$TIME and gdp_file$year are same variable.

Let's change variable name LOCATION to iso and TIME to year and Value to trust because new names are more easy to understand.

Now, let's see relationship between trust and gdp, trust and capi.
I use plot() function.

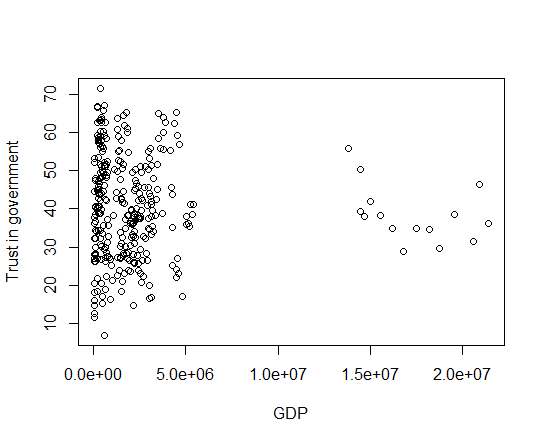
Since GDP has vary wide range, let's see log(GDP).
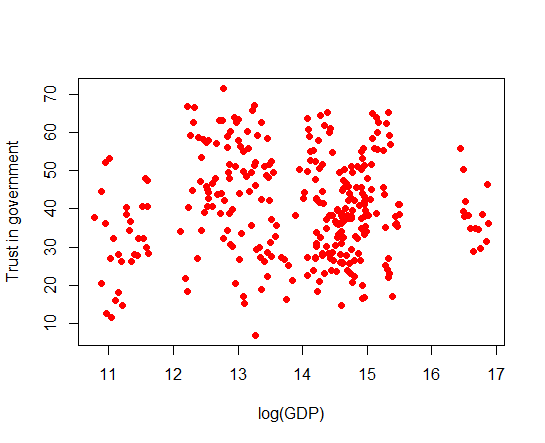
It seems there is no relationship.
Next, let's see Trust in government and capi: per capita GDP.


I see no need to convert logarithm for per capita GDP and there seems no relationship with trust and capi.
Let's see correlation with cor().

As scatter plots showed, there are weak correlation between trust, l_gdp and capi.
That's it. Thank you!
Next post is
To read 1st post,