
Generated by Bing Image Creator : Pphotograph, Alps, Mountains, Green Grass, Cows
This post is following of the above post.
In this post, I will add per capita GDP data to the Influenza vaccination data.
From OECD website,
https://data.oecd.org/gdp/gross-domestic-product-gdp.htm
I got CSV file and modified like below.

I load this file using read_csv() funtion.

In MEASURE, there are two kind of measures, one is MLN_USD and the other is USD_CAP.
I use pivot_wider() function to make new variables for them.

I use inner_join() function to merge df and df_gdp.

Let's see summary statiscics of MLN_USD and USD_CAP, MLN_USD is GDP value and USD_CAP is per capita GDP value.

Let's make histograms.
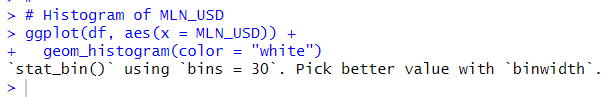

This histogram shows very skewed. Let's convert it to natural log.

Let's see lgdp histogram.
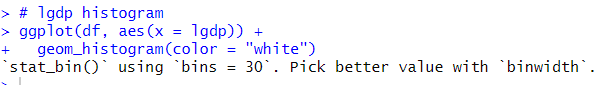

This histogram looks much betther than previous one.
Now, let's see USD_CAP histogram


USD_CAP also shows some skwed shape.
Let's make log USD_CAP and make a histogram.

This histogram looks much better.
All right, it is time to see relationship between vaccination rate and GDP.
Let's make a scatter plots


I cannot tell there is relationship between influenza vaccination rate and gdp data.
That's it. Thank you!
Next post is
To read the first post,