
Bing Image Creator -- Photograph of small yellow flowers, high mountains and blue sky and clouds

In this post, I will analyze OECD Influenza vaccination rates with R.
First, I load tidyverse.

Then, I use read_csv() function to load data on CSV file.

Let's see first few rows.
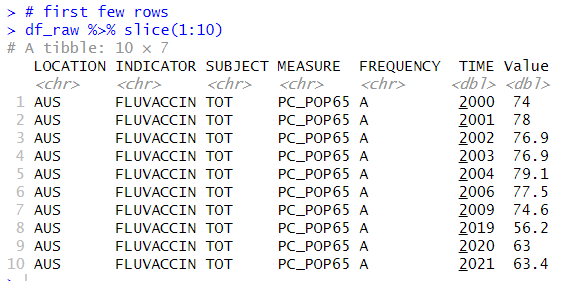
I see AUS has 74% vaccination rates in 2000, 78% in 2001 and so on.
Next, let's use skim() function from skimr package to see how the dataframe is.

I see INDICATOR, SUBJECT, MEASURE and FREQUENCY have only 1 n_unique. Thus I can remove those variables.

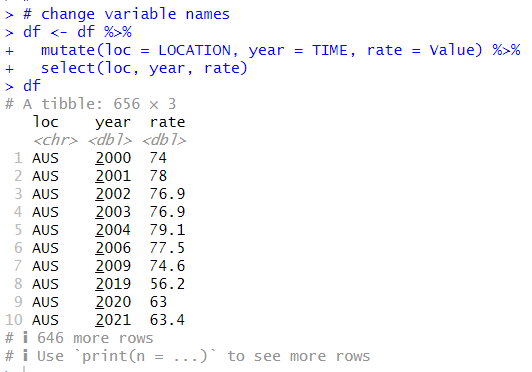
And I will cange variable names.
Let's see summary statistic of year and rate.

I see year starts from 2000 and ends to 2022. rate range is from 0.90 to 94.80, mean is 48.18.
That's it. Thank you!
Next post is