
UnsplashのQingbao Mengが撮影した写真
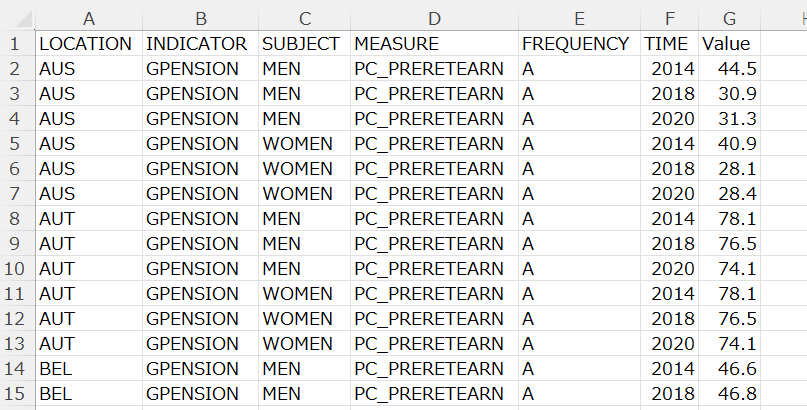
In this post, I will analyze OECD Gross pension replacement rates data. According to the above definions, the higher replacement rates implies richer retirement life wit pension income.
First, I downloaded below CSV file from OECD web site.
Pensions - Gross pension replacement rates - OECD Data
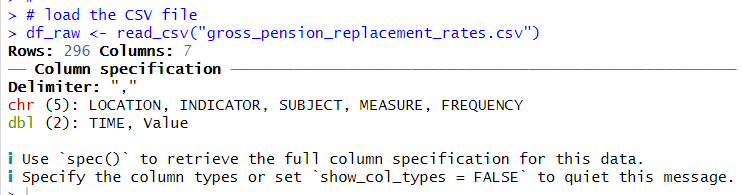
I use R to analyze this data. I use tidyverse package.
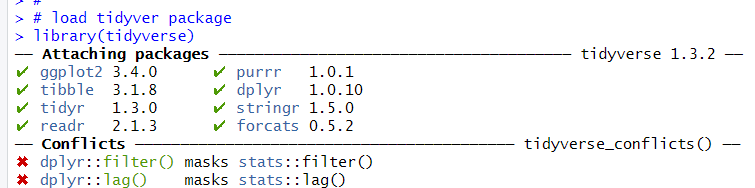
Next, I use read_csv() function to load the CSV file data into R environment.
Let's use glimpse() function to see how df_raw object looks like.
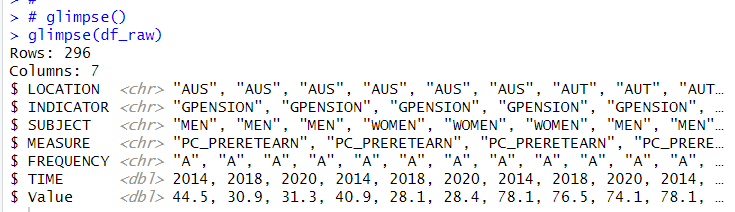
I see the df_raw data frame has 296 observations and 7 variables.
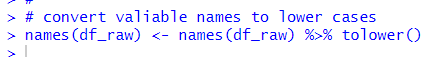
I use tolower() function and names() to convert valiables names to lower cases.
Next, I use skim() function from skimr package to see what each variables looks like.
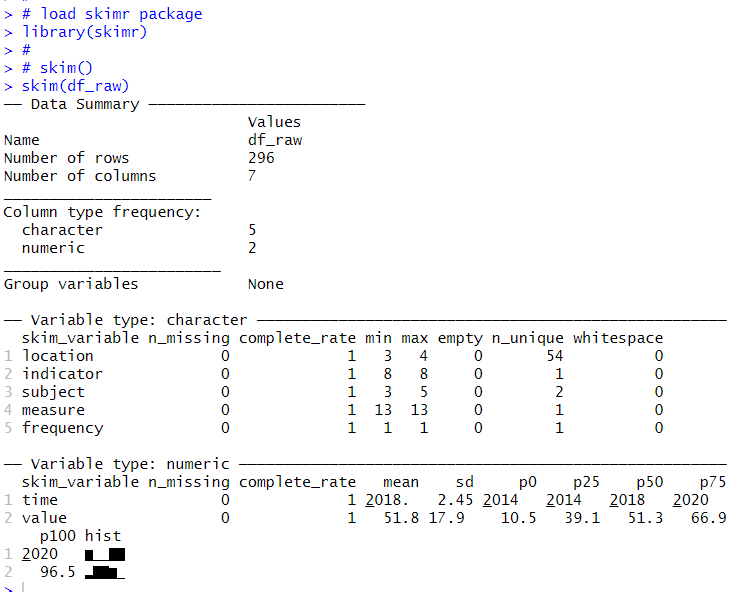
skim() function is very helpful to see what each varibales look like. I see there are no missing values in df_raw, indicator, measure and frequency are only 1 unique values, this means I can ignore those variables to analyze.
location has unique 54 values. subject has 2 unique values.
indicator has only "GPENSION", measure has only "PC_PRERETEARN", frequency has only "A".
time is from 2014 to 2020. value is gross pension replacement rate, it varies from 10.5 to 96.5.
That's it. Thank you!
Next post is