
This post is following of the above post.
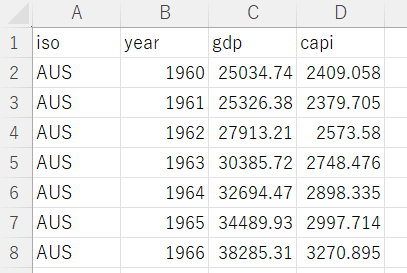
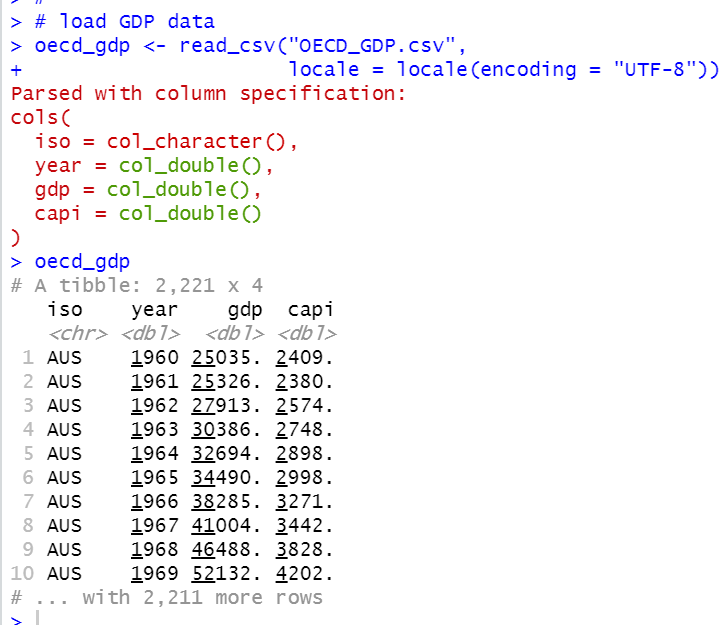
I have GDP data file like below, which I downloaded OECD web site.
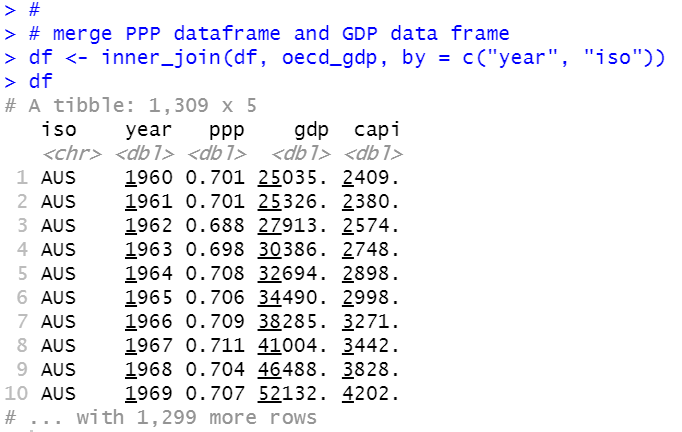
I am going to merge this data to previous ppp data.
Firstly, I upload this CSV file into R using read_csv() function.
Then, I use inner_join() function to mergr previous dataframe;df and this GDP dataframe;oecd_gdp.
gdp is real GDP and capi is per capita GDP.
Let's see ppp and gpd graph.
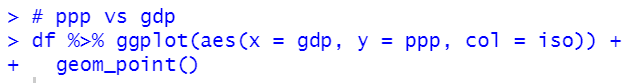
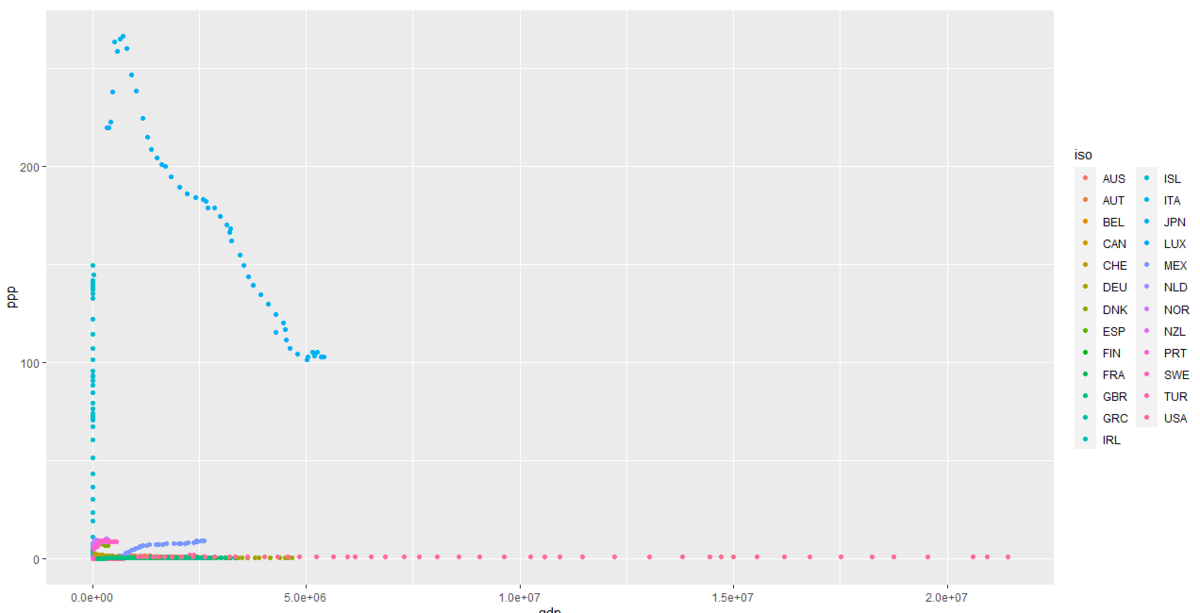 Since GDP and PPP have wide range data, above graph is not good to see.
I change ppp to log(ppp) and gdp to log(gdp).

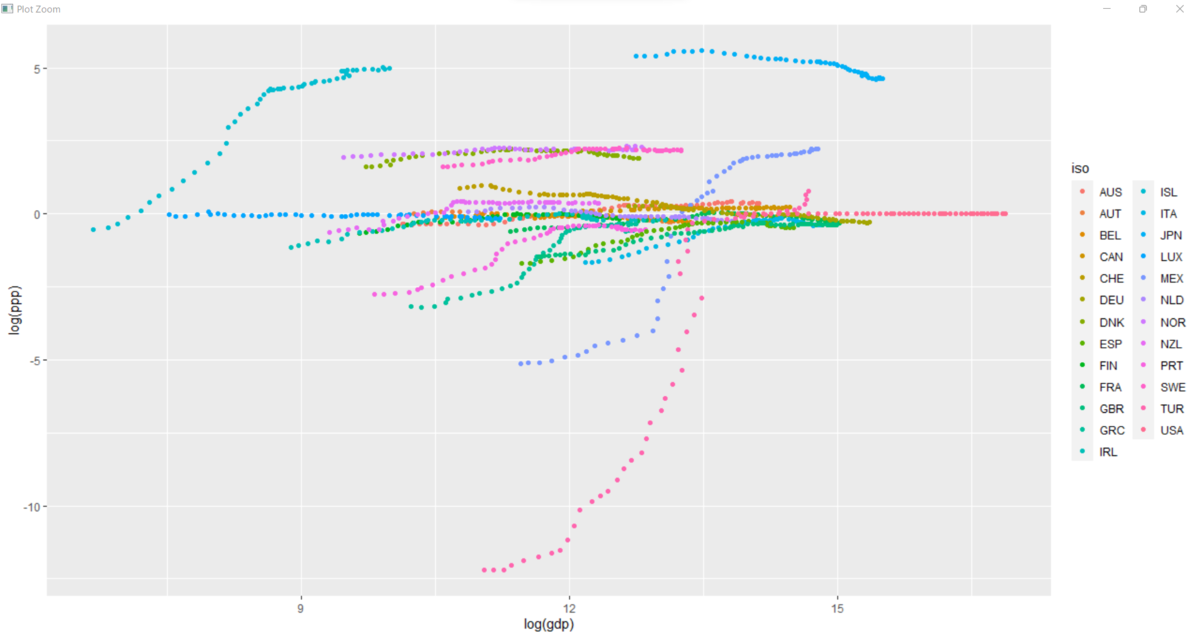
I see many countries have positive correlation between log(gdp) and log(ppp).
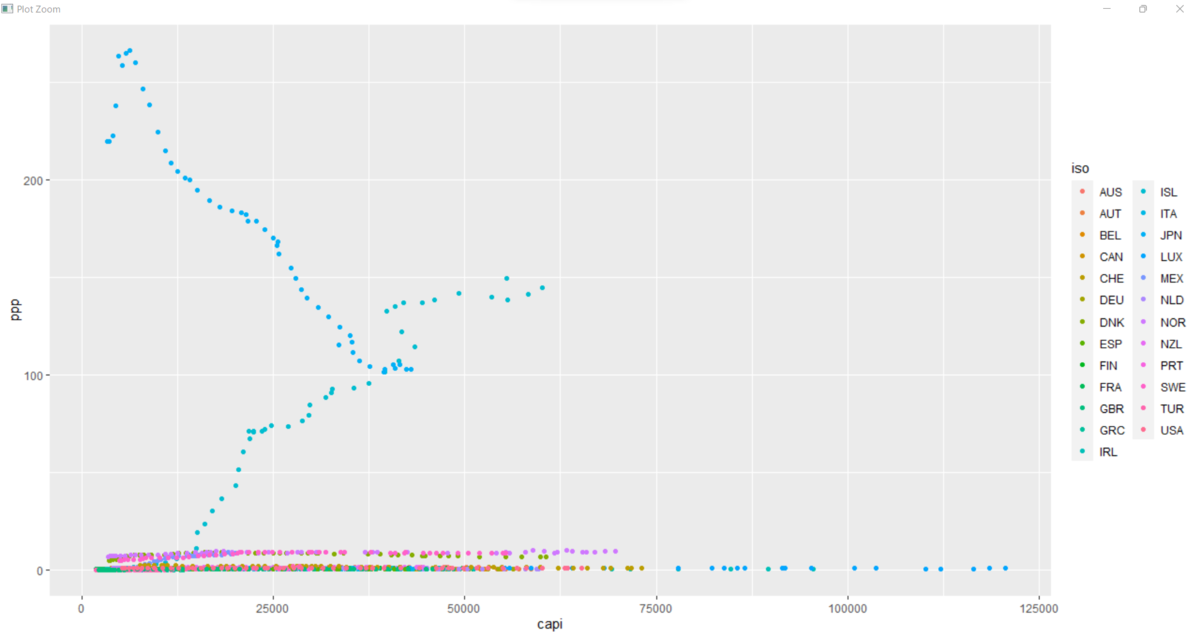
Now, let's see ppp and capi: per capita GDP.

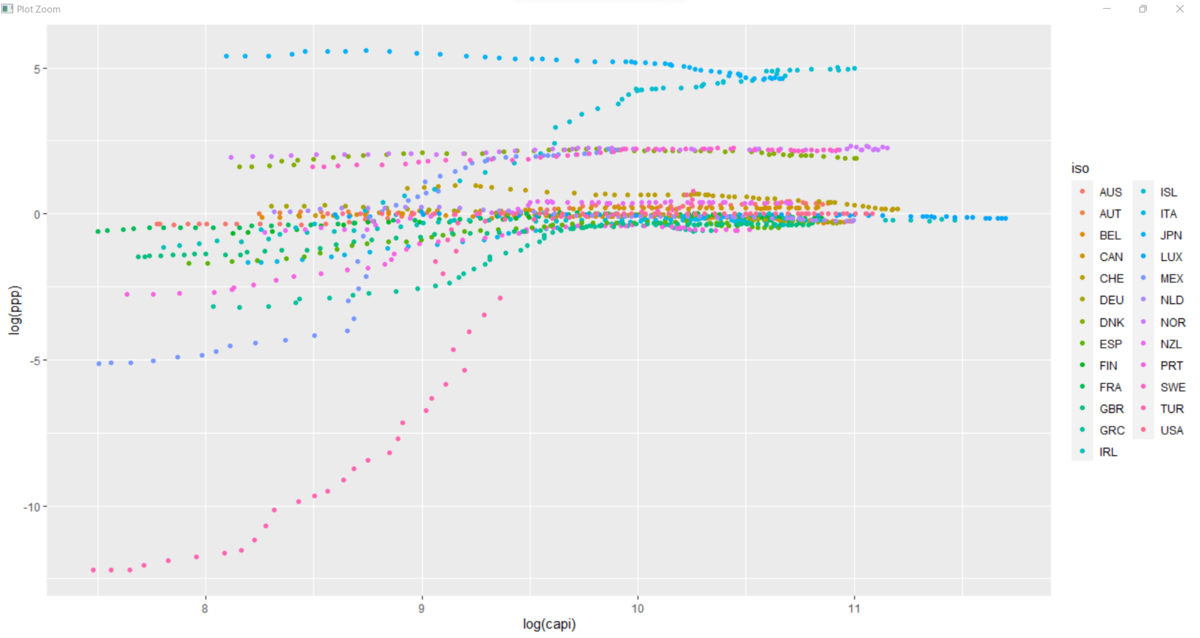
Again, let's convert ppp to log(ppp) and capi to log(capi).

At this point, I realize it is better to see log(ppp), log(gdp) and log(capi) than ppp, gdp and capi in order to analyze them, I am going to make a new vatiables.
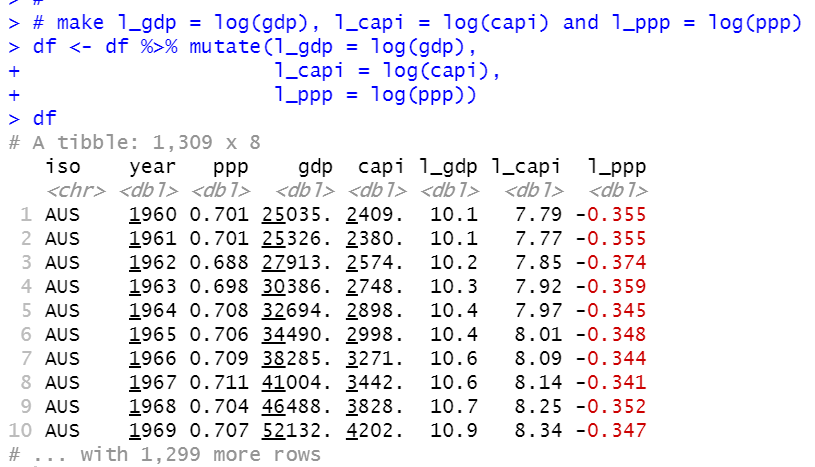
l_ppp is log(ppp), l_gdp is log(gdp) and l_capi is log(capi).
Let's see correlation between l_ppp and l_gdp by year.
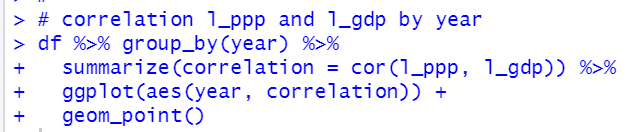
We see 1960 ~ 1969 and 2020 are different characteristics than other years. Correlation between log(gdp) and log(ppp) seems negative correlation.
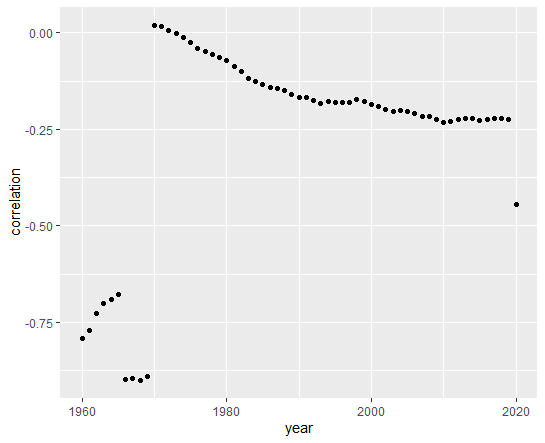
Let's see log(ppp) and log(capi) by year.

We see 1960 ~ 1969 and 2020 are silightly different characteristics. Correlation between log(ppp) and log(capi) seems positive correlation.
I make df subset for excluding 1960 ~ 1969 and 2020.
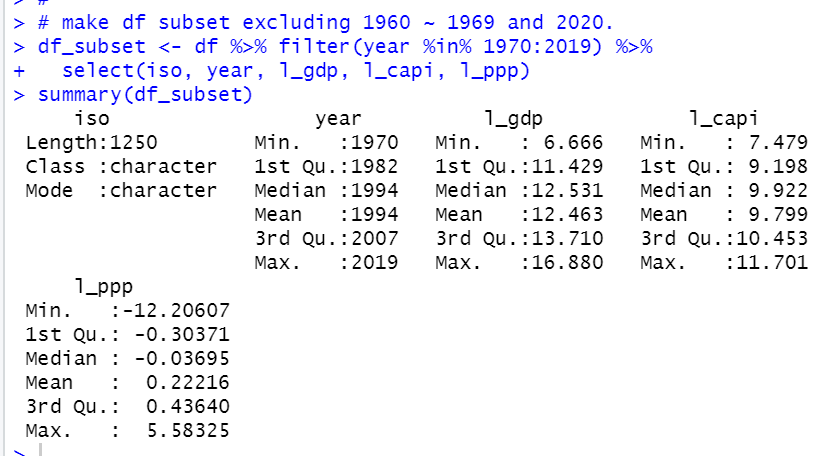
Using this df_subset, let's see l_ppp and l_gdp correlation by country.
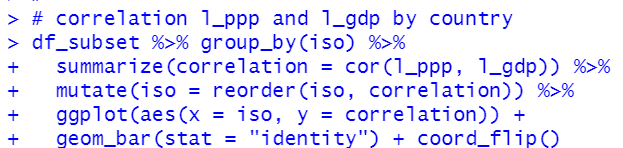
I see USA is excluded because USA has no variation for l_ppp. Some countries have positive correlation and some has negative correlation.
I will delete USA from df_subset and let's see l_ppp and l_capi by country.
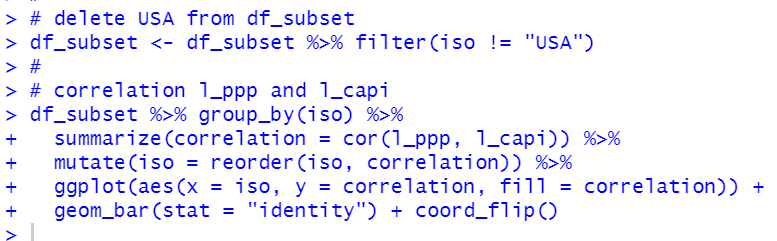
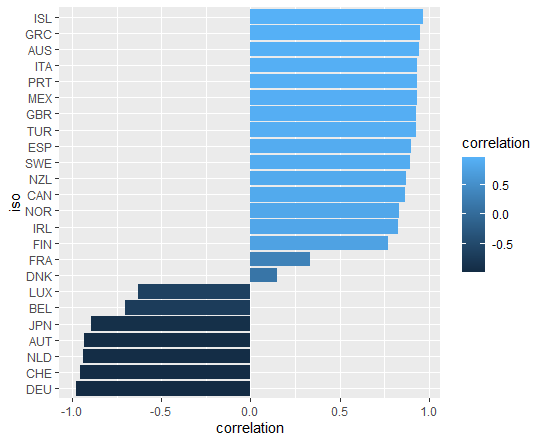
Like l_ppp and l_gdp, some contries have positive correlation between l_ppp and l_capi and some have negative correlation.
That's it. Thank you!
The next post is
To read 1st posrt