
Photo by Aron Visuals on Unsplash
This post is following of the above post.
In this post, I will do PCA(Principal Component Analysis).
I refer below web site.
Principal Component Analysis (PCA) 101, using R | by Peter Nistrup | Towards Data Science
Firstly, I will make subset for PCA from df.
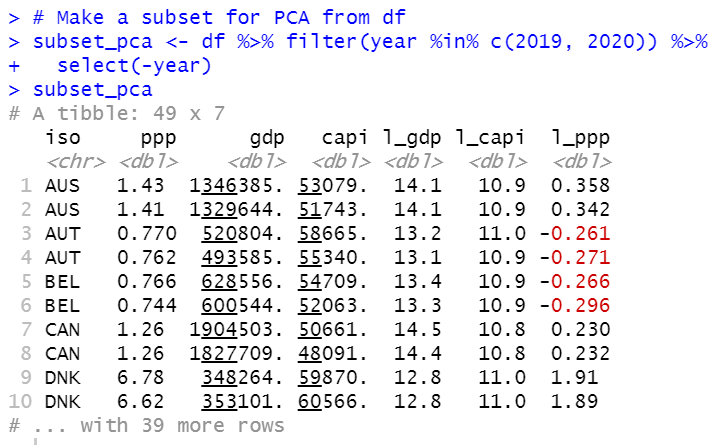
Now, I have subset_pca data frame which has 6 mumerical varibles, ppp, gdp, capi, l_gdp, l_capi and l_ppp.
Then, I use prcomp() function for PCA.
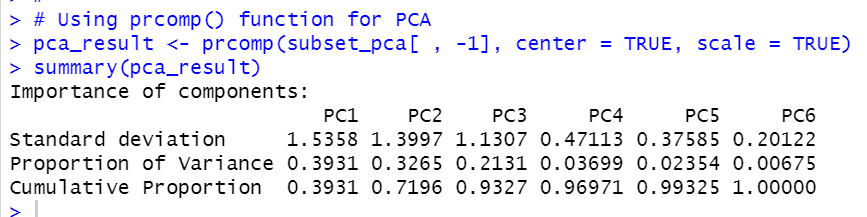
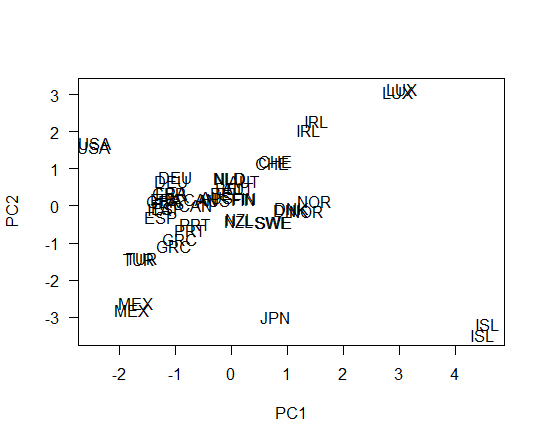
Above results tells that PC1 counts 39% of variables, PC2 counts 32% variable. So, PC1 and PC2 counts 72% variable.
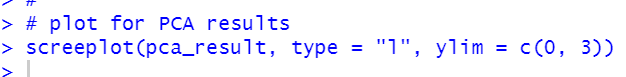
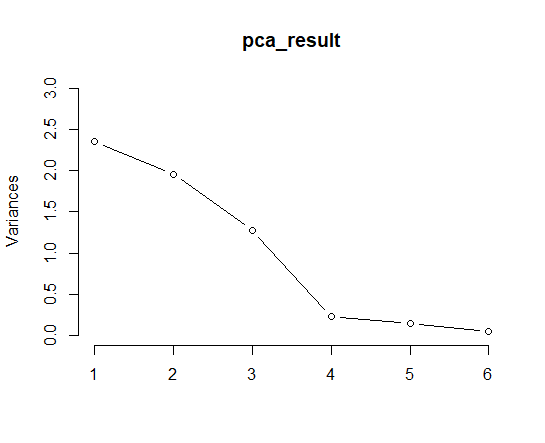
Then, I make a plot to visualize PCA result using screeplot() function.
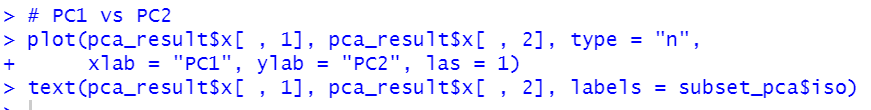
Let's make PC1 vs PC2 plot
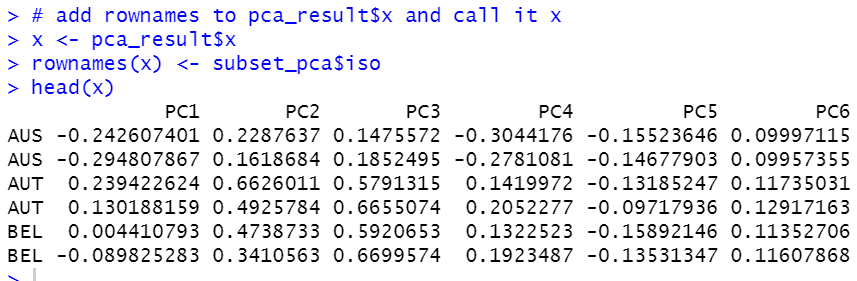
Then, I add rownames to pca_result$x.
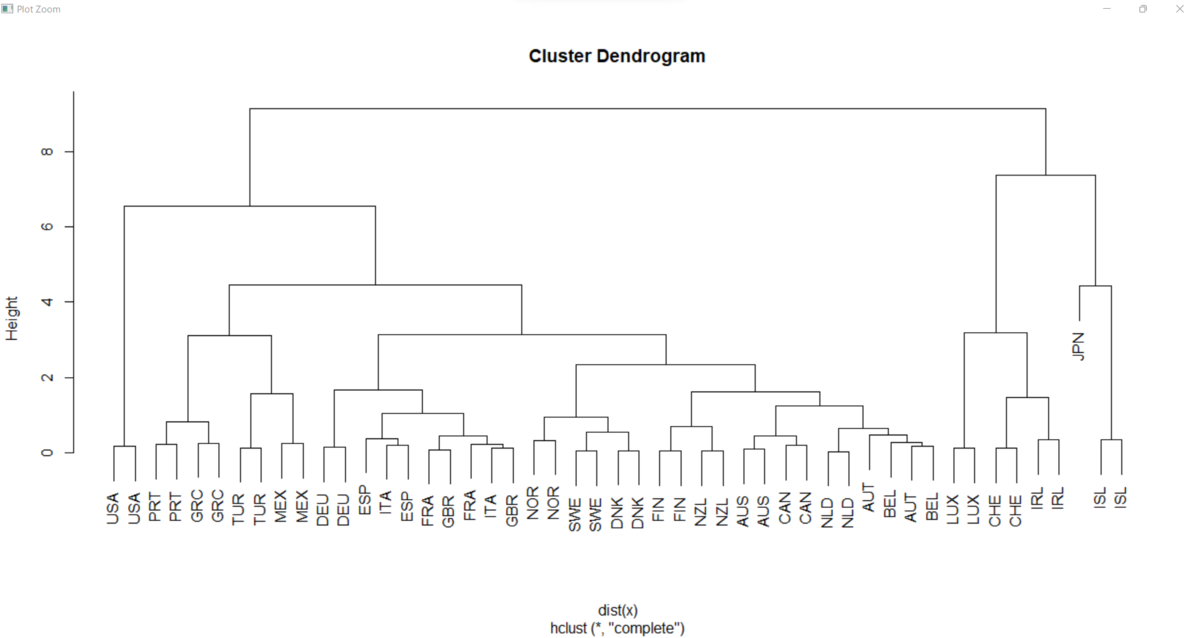
Then, let's make a hierarchial culstering dendrogram.

That's it. Thank you!.
The next post is
To read the 1st post,