
Photo by Andrew Svk on Unsplash
In this post, I will analyze OECD Purchasing power parities (PPP).

From the OECD website, I got below CSV file.

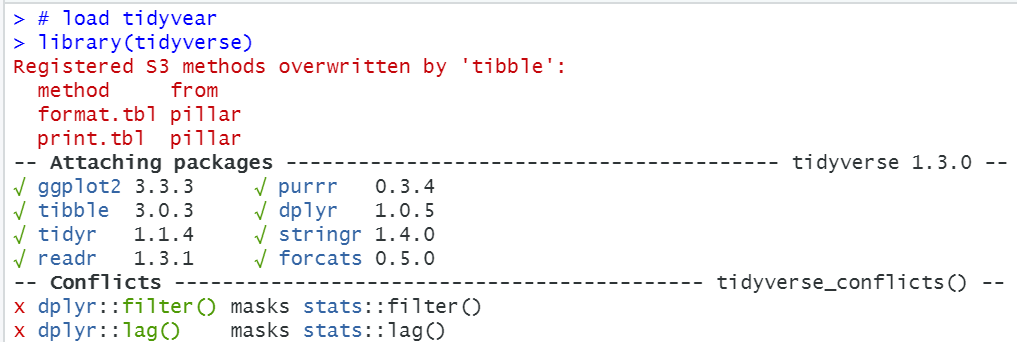
I analyze those data with R. Firstly, I load tidyvesr package.
Let's load the CSV file with read_csv() function.

We have 7 variables, LOCATION, INDICATOR, SUBJECT, MEASURE, FREQUENCY, TIME and Valie.
Let's check each variables.
LOCATION

USA, TUR, SWE ~~ BEL, AUT, AUS has 61 observations.
So, I will filter those LOCATIONS only.

INDICATOR
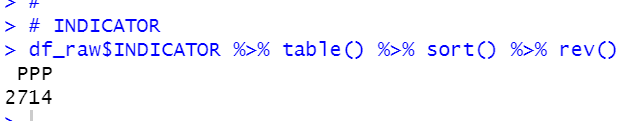
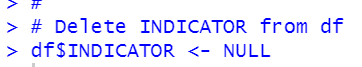
For INDICATOR, there is only PPP. So I delete INDICATOR from df.
SUBJECT
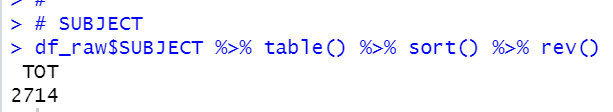
For SUBJECT, there is only TOT, so I can delete SUBJECT from df too.

MEASURE
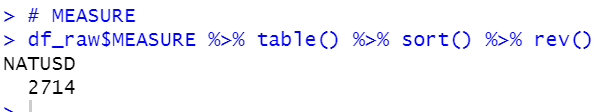
For MAESURE, there is only NATUSD, so I will delete MEASURE too.

FREQUENCY

For FREQUENCY, there is only A, so I will delete it too.

TIME
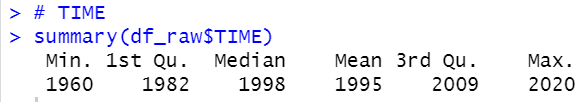
TIME is numeric variable, so I use summary() function. the most recent TIME is 2020.
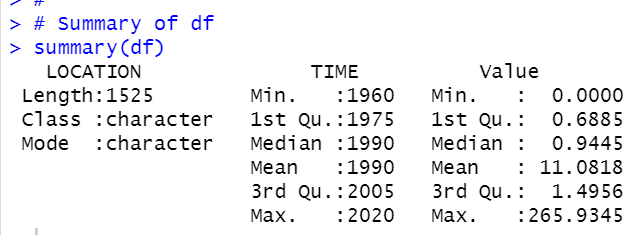
Value

Value is Purchasing power parity (PPP). I see Median is 1.007 while Mean is 68.948, so there must be skewed data.
All right, let's see dataframe "df" with summary() function.
I will change variables names to iso, year and ppp. and change data type to factor for iso.
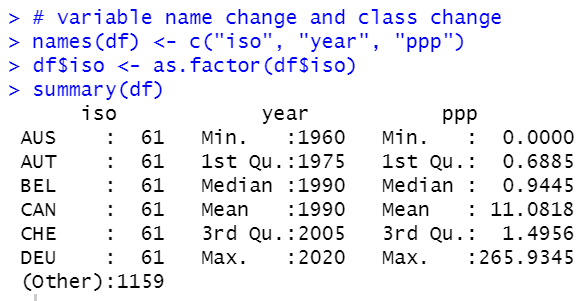
All right, now I have a good data frame to analyze.
That's it. Thank you!
Next post is