
Photo by Sora Sagano on Unsplash
This post is following of the above post.
In this post, I will do time-series analysis. I use JPN data only.
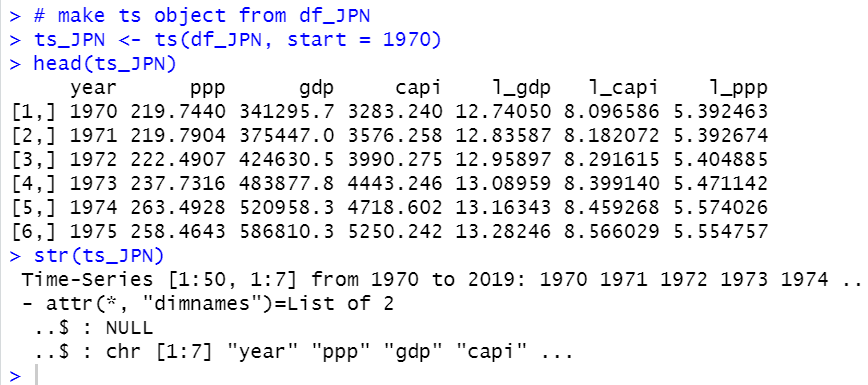
Firstly, I make JPN only dataframe.
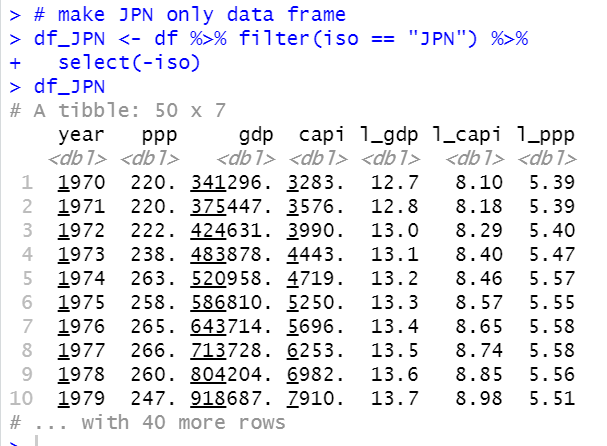
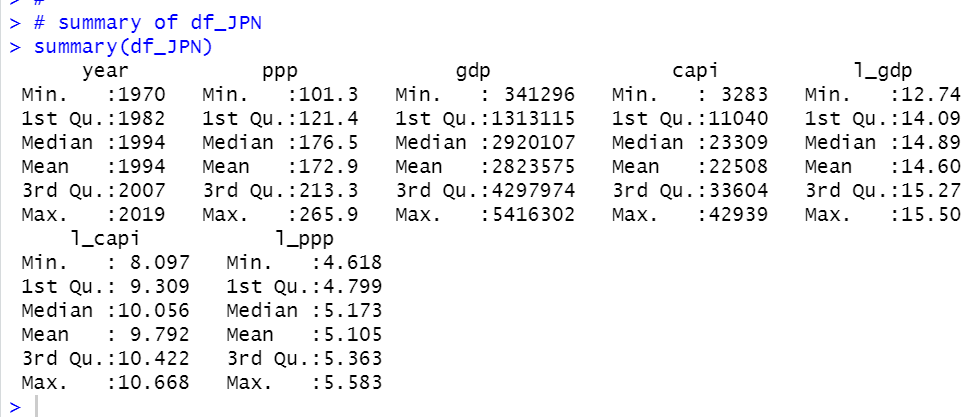
Then, let's see statistical summary of df_JPN.
summary() function does not show standard deviations and CV (Coefficient of Variation).
So, let's calculate it.
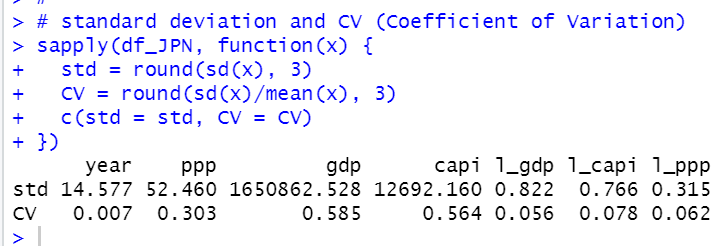
gdp is the most variable data and l_ppp is the least variable data excluding year.
Let's see correlation matrix.
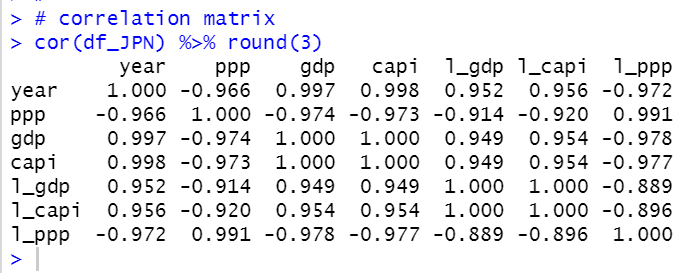
I see each variables are strongly correlated each other.
For time-series analysis, it is convinenent to use ts object, so I will make ts object from df_JPN and name it as ts_JPN.
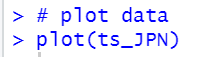
plot() function can make a line chart with ts object like below.
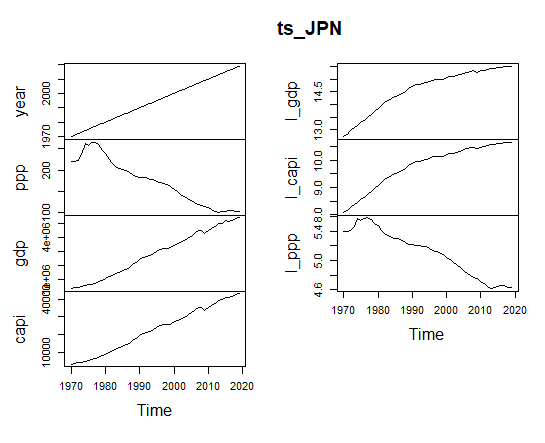
I will make a static time-serires model.
Above model means
l_ppp = -10.08 -0.34*l_gdp + u
gdp inclease by 1%, ppp will decrease by 0.34%.
In time-series analysis, we have to check if there is serieal correlation.
I make an object for residuals and plot it.
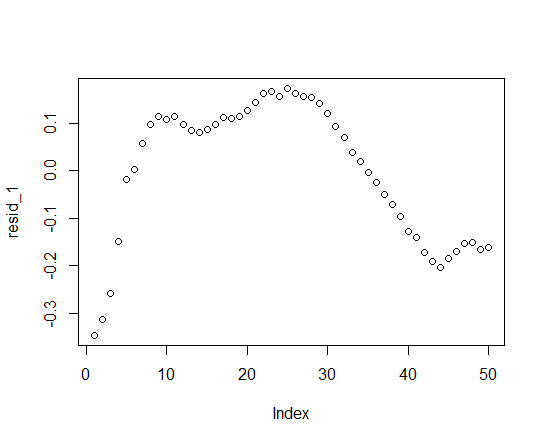
I see there are 50 residual values and above plot shoes there seems serial correlation.
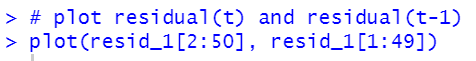
Let's see if there is residual(t) and residual(t-1) correlation. Firstly, let's see a scatter plot.
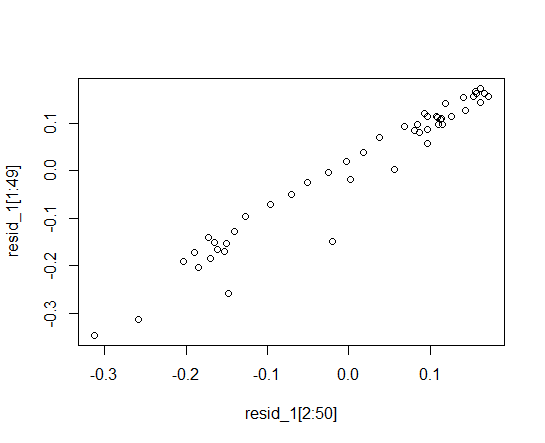
We see there is strong positive correlation between residual(t) and residual(t-1).
Let's do linear regression and see t-statistics.
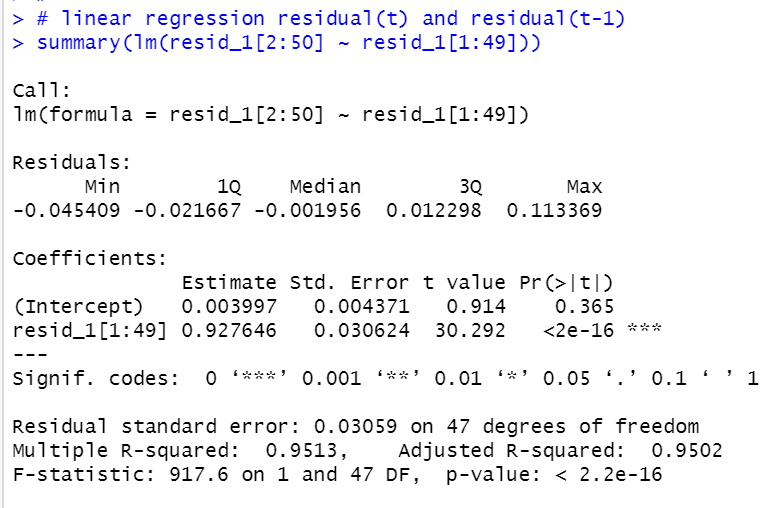
t value is 30.292 and p-value is almost 0. So, we can say there is serial correlation in
l_ppp = 10.8 - 0.34*l_gdp + u
That's it. Than you!
To read from the 1st post,