
In this post, I will upload OECD Nutrient balance data in to R.
From OECD web iste, I downloaded data csv file like below.
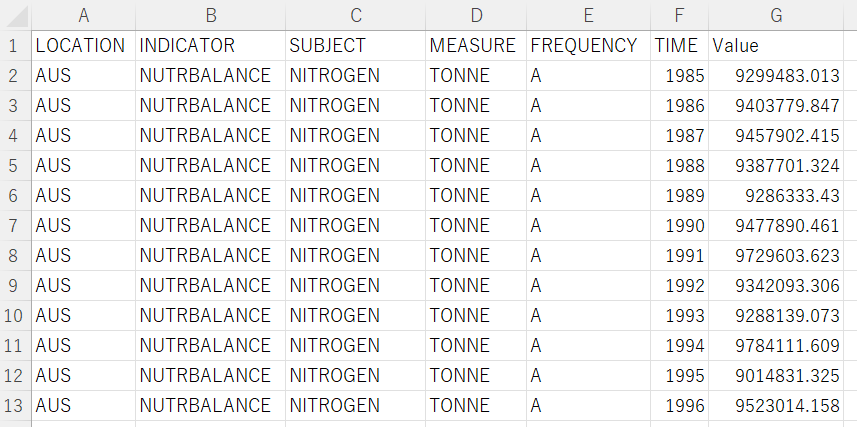
Let's analyze this data in R!
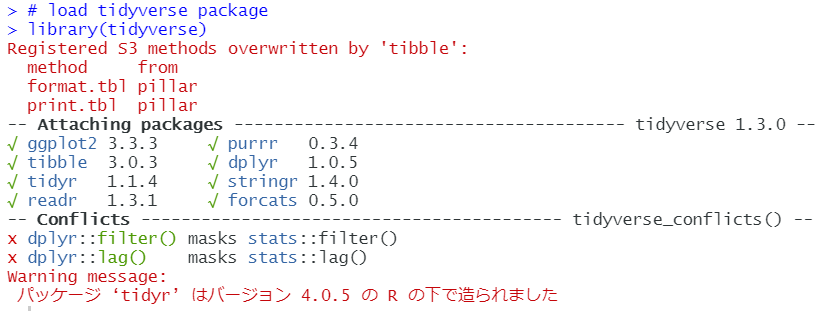
Firstly I load "tidyverse" package, this is the great package for R users.
I use read_csv() fundtion to load CSV file data into R.
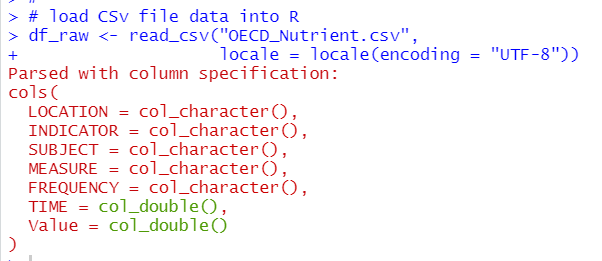
LOCATION ~ FREQUENCY are character, TIME and Value are numeric data.
Let's check how many NA in each column.
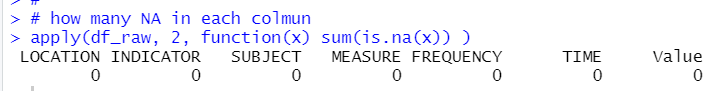
Good news! There is no NA in the data.
Let's check LOCATION data.
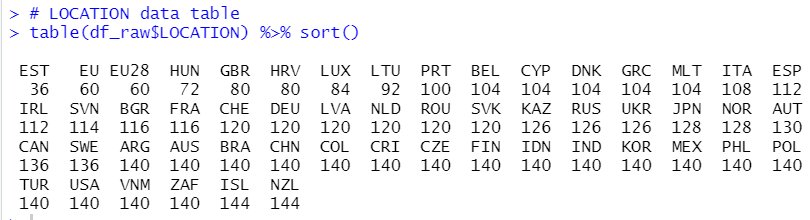
Almost LOCATION have more than 100 observations.
Let's check INDICATOR
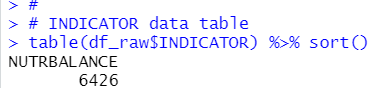
For INDICATOR, there is only one value, "NUTRBALANCE".
How about SUBJECT?
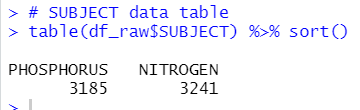
SUBJECT has two values, PHOSPHORUS and NITROGEN.
Let's go to MEASURE
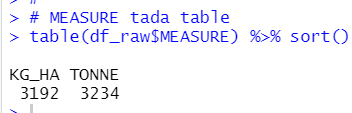
There are two values for MEASURE, KG_HA and TONNE
Let's check FREQUENCY.
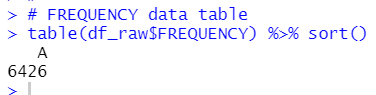
There is only A for FREQUENCY.
For character type variables, INDICATOR and FREQUENCY have only one value, so I can delete those two colmuns later.
Let's chack TIME and Value, they are numeric data.
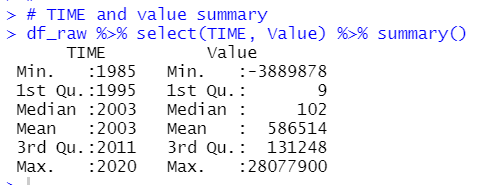
For TIME, the oldest year is 1985 and the newest year is 2020.
For Value, there is negative value. According to OCED description, negative value means declining soil fertility.
Next, let's make a data frame for analysis.
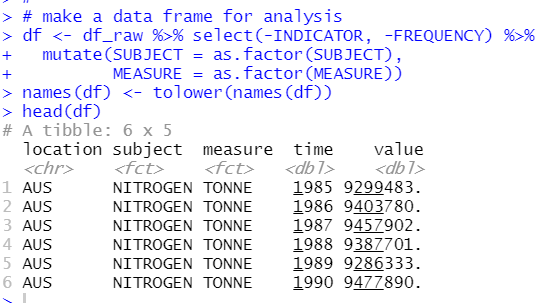
I removed INDICATOR and FREQUENCY, converted to factor type for SUBJECT and MESURE and lastly, converted colmun names to lower character.
Let's see subject X measure table.
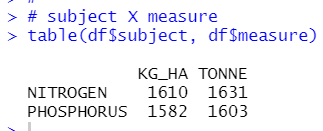
Each combinations seems almost same observations.
That's it. Thank you!
Next post is