
UnsplashのAlexander Schimmeckが撮影した写真
In this post I will analyze OECD Social spending data using R.
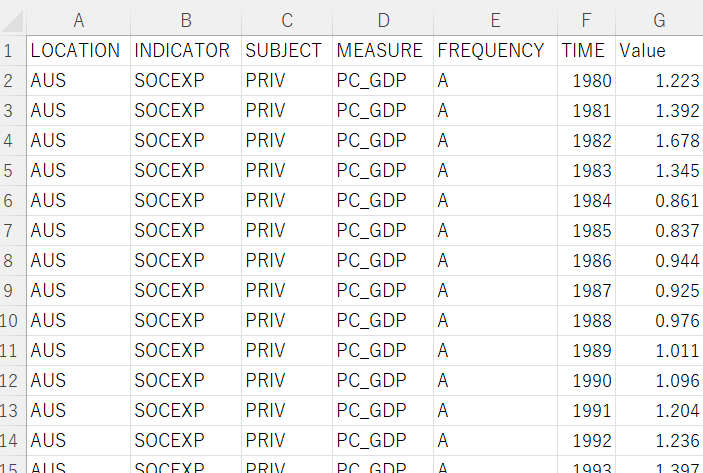
OECD (2022), Social spending (indicator). doi: 10.1787/7497563b-en (Accessed on 26 November 2022)
This indicator is measured as a percentage of GDP or USD per capita.
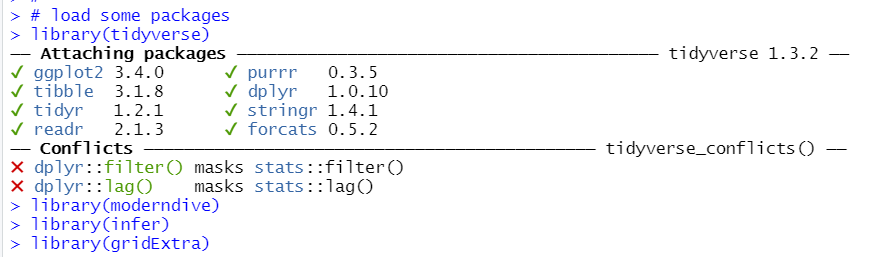
From the web site, I downloaded CSV file as below.
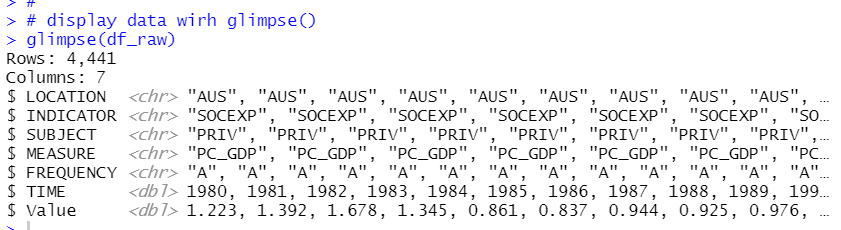
Before loading the CSV file, I load some packages such as tidyverse and so on.
I loaded tidyvese, moderndive, infer and gridExtra packages. tidyverse is de-facto standard package in R for data science. I load moderndive package and infer package because I am learning Statistical Inference via Data Science (moderndive.com)

I loaded gridExtra package to display multiple plots at one screen.
Now, let's load the CSV file data with read_csv() function.

Then, using glimpse() function, let's check if data is correctly loaded.
Nice! The CSV file data is loaded succesfully into R.
There are 7 variables in the dataframe, let's see each variables one by one.
Location:
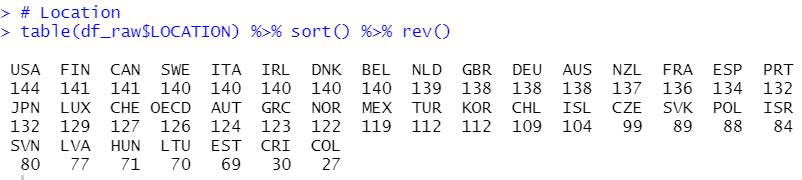
LOCATION is ISO country code, I see USA(United States of America) has the most observations.
INDICATOR:
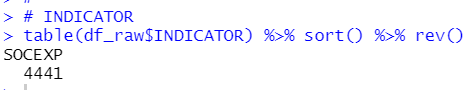
INDICATOR has no variation, has just one value, SOCEXP. So, I will remove INDICATOR.
![]()
SUBJECT:
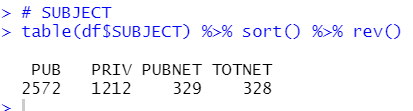
According to OECD web site below, PUB means Public, PRIV means Privae, PUBNET means Public net and TOTNET means Total net. We see PUB has the most observations.

MEASURE:
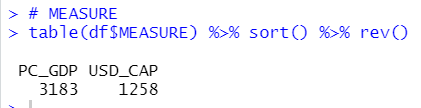
PC_GDP means a percentage of GDP, USD_CAP means ISD per capita.
FREQUENCY:
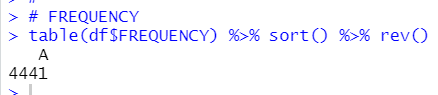
There is no variation in FREQUENCY, then I remove it.
TIME:
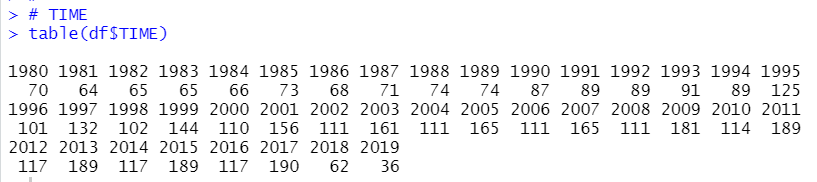
TIME means year, I see 2017 has the most observations, 190.
Value:
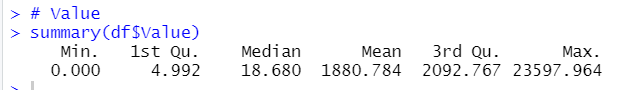
There is no NA in Value.
That's it. Thank you!
Next post is