
Photo by CHUTTERSNAP on Unsplash
This post is following of above post.
In the previous post, we made a dafa frame called a "df".

We see there are two values in subject, GROSSADJ and NET, two values in measure, AGRWTH and USD_CAP.
Thus, there are four possible combinations, GROSSADJ & AGRWTH, GROSSADJ & USD_CAP, NET & AGRWTH and NET & USD_CAP.
Let's check them.

We find there is no observations for GROSSADJ & AGRWTH.

We find there is 1054 observations for GROSSADJ & USD_CAP.
Let's make a dafa frame for GROSSADJ & USD_CAP only.

Let's see about NET & AGRWTH
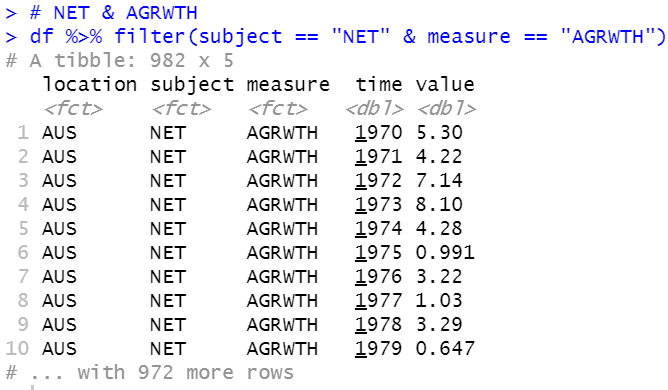
We see there are 982 observations for NET & AGRWTH.
Let's make a dafa frame for NET & AGRWTH only.

Let's see NET & USD_CAP.
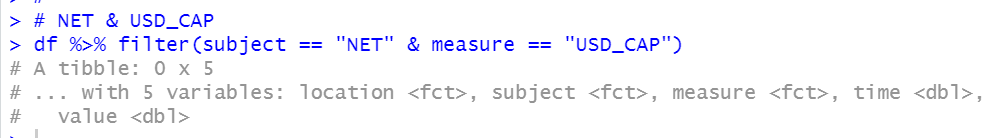
We find there is no observations for NET & USD_CAP.
All right, we have two data frames now, one is "gr_us", which is for GROSSADJ & USD_CAP and the other is "ne_ag", which is for NET & AGRWTH.
Let's merge them with inner_join() function.

Let's see summary of "df2".

We see this panel data strats from 1970 to 2020.
The minumum GROSSADJ & USD_CAP is 1302, the maximum is 53202, the average is 21061.
The minumum NET & AGRWTH is -12.712, the maximum is 20.8168 and the average is 2.4073.
That's it. Thank you!
Next post is
To see the 1st post,