
Photo by Stephanie LeBlanc on Unsplash
This post is following of the above post.
Let's check how many observations each country has.
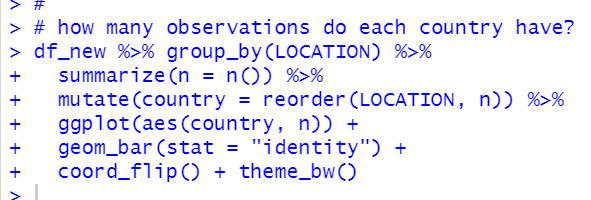
Max observations is 24. Many country has more than 20 observations.
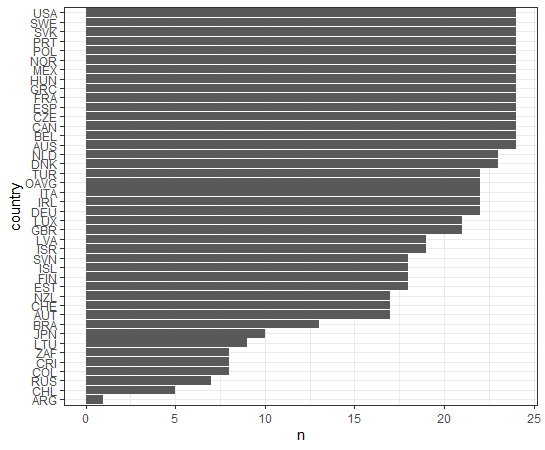
So, let's see average value for countries which has more than 20 observations.
We see TUR has the highest NEET percentage and NLD has the lowest one.
Then, let's see relationship between NEET and GDP data.
Let's import GDP data like below.
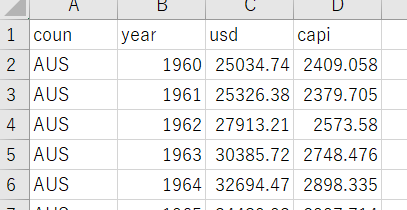
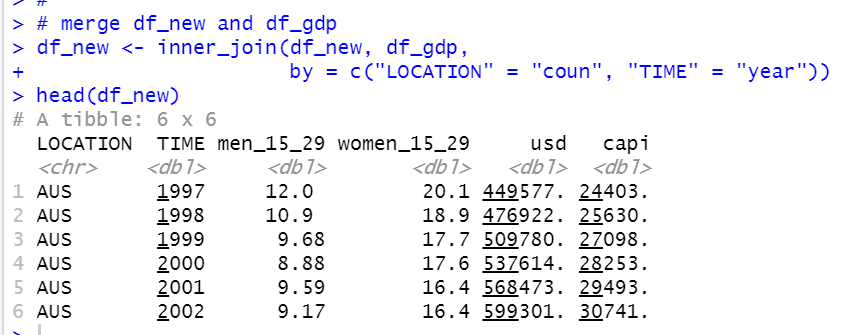
coun equals LOCATION, year equals TIME. We can merger this data by coun = LOCATION and year = TIME.
usd is GDP in USD and capi is per capita GDP in USD.
Good.
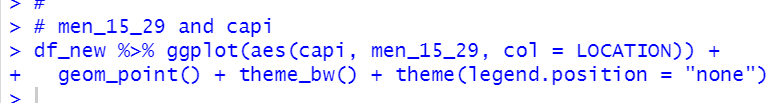
Let's see men_15_29 and capi relationship.
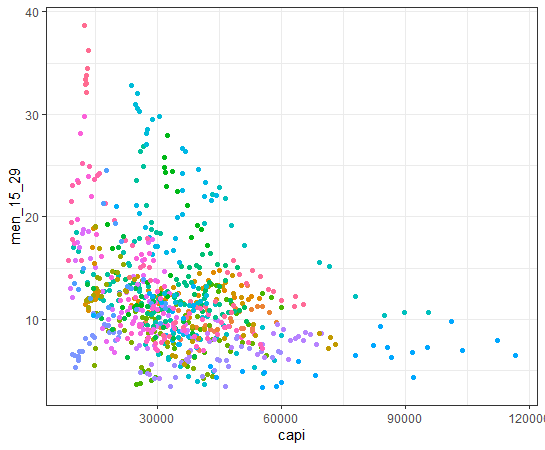
There seems negative correlation.
Let's see women_15_29 and capi.
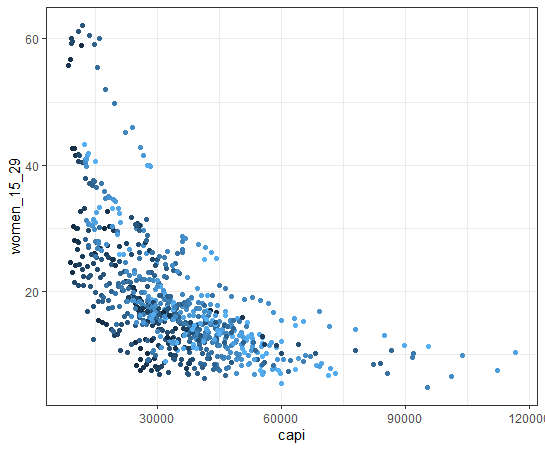
women_15_29 and par capita GDP relationship is simmilar to men_15_29 and per capita GDP relationship.
That's it. Thank you!
To read from the 1st post,