
This post is following of the above post.
In the previous post, I did sinple linear regression, it menas there is only one explanatory vatiable. In this post I will do multiple linear regression, it means there are multiple explanatory variables.
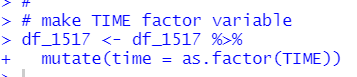
Firstly, I make time variable which is factor type variable.
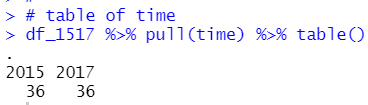
Let's see table of time.
Then, I add time for explanatory vatiable.

Let's see regrettion table with moderndive package's get_regression_table() function.
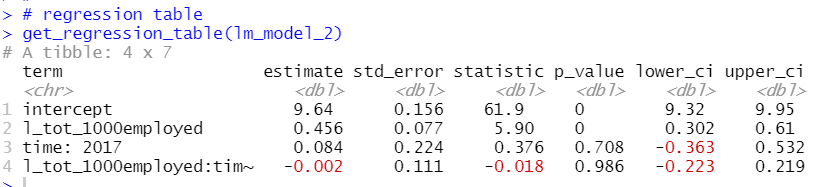
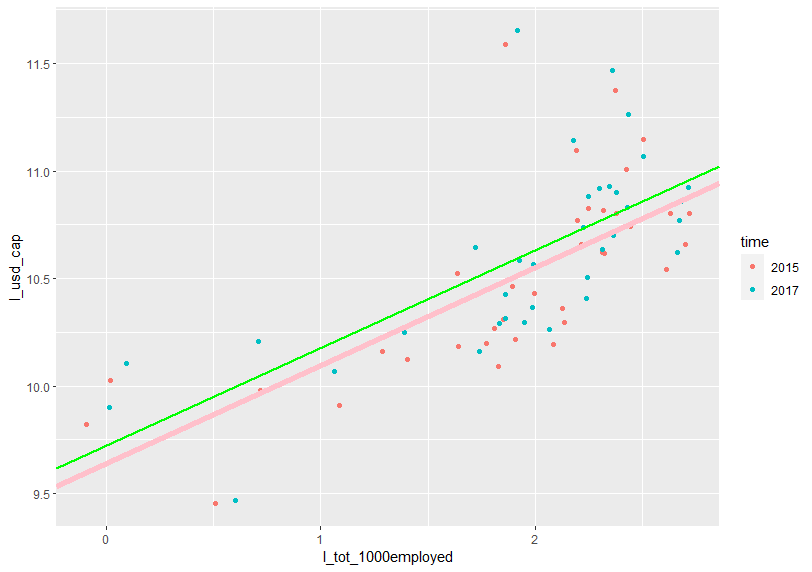
p_value of time: 2017 or l_tot_1000employed:time is greater than 0.05, so I know those variables are not statistically significant.
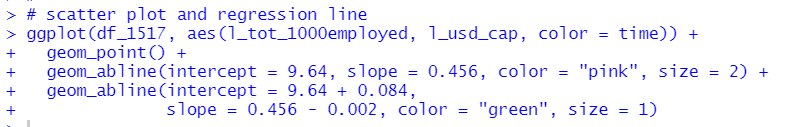
Let's visualize this regression.
Next, I use l_women_pc_researcher instead of time.

Let's see the regression table.
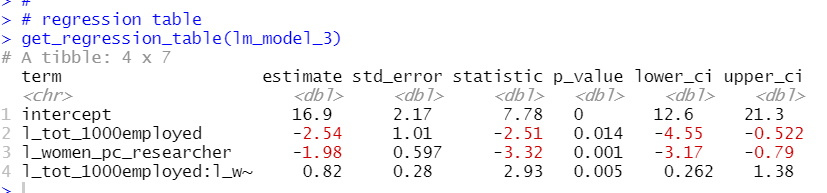
I see l_tot_1000employed, l_women_pc_researcher and l_tot_1000employed:l_women_pc_researcher have small p-value less than 0.05.
So, those three are statistically significant.
Let's visialize actual l_usd_cap and estimated l_usd_cap.
Firstly, I show regression data point with moderndive's get_regression_package
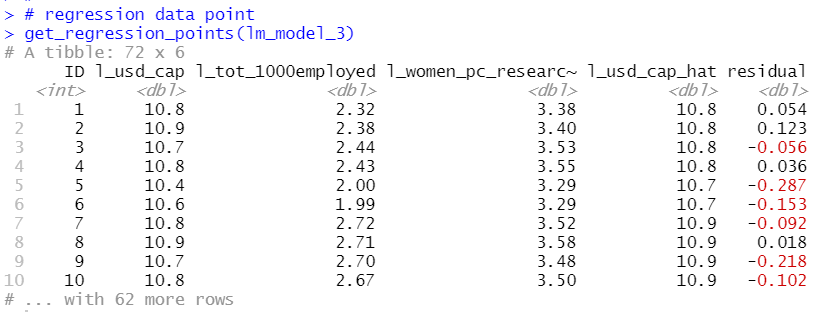
I used ggplot() + geom_point() function to draw a scatter plot.
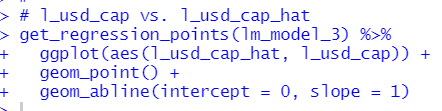
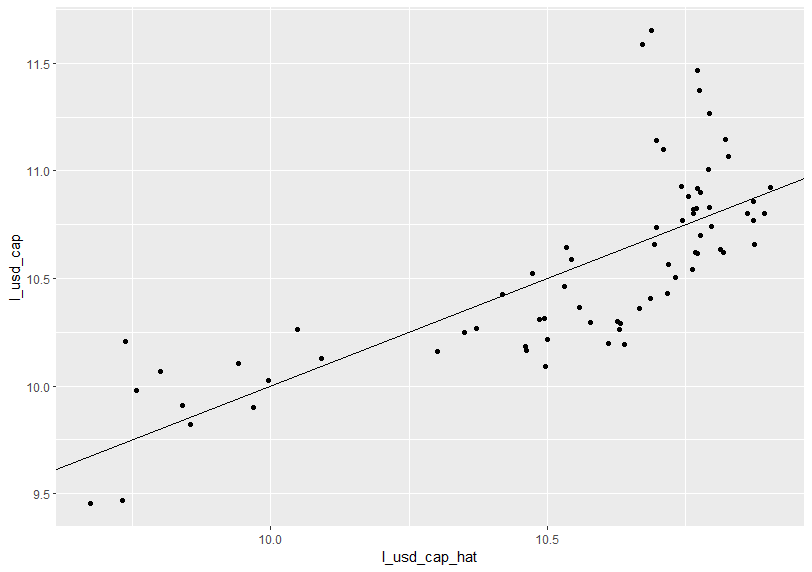
If actual l_usd_cap and estimated l_usd_cap are exactly same, all scatter pooints shold be on the line.
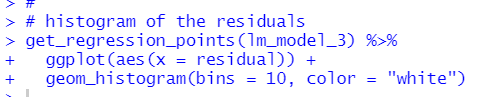
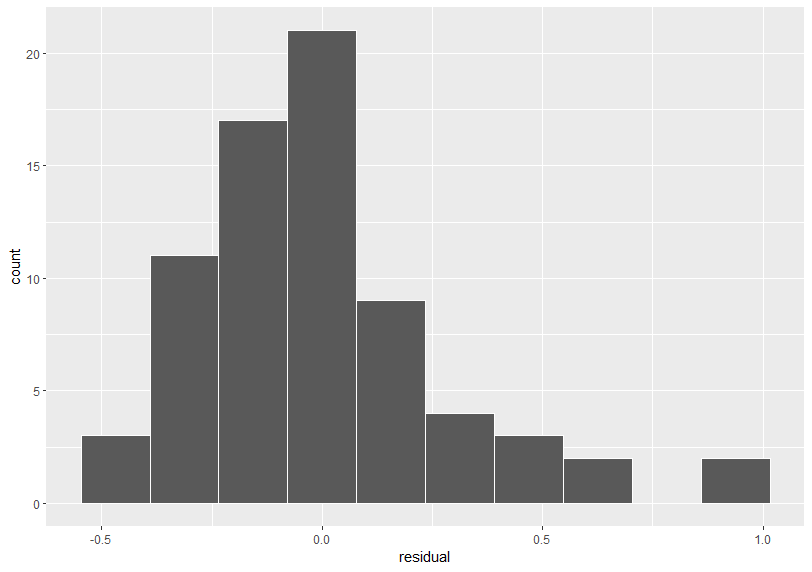
Let's see the histogram of the residuals.
Now, I have three linear regression models. Let's compare them with moderndive's get_regression_summaries() function.
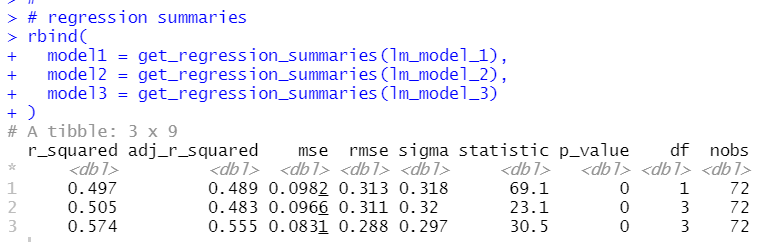
model3, which has two explanatory variables, l_tot_1000employed and l_women_pc_researcher, has the smallest emse and the largest adj_r_squared.
That's it. Thank you!
To read from the fist post,