
This post is following of above post.
In the previous post, I made panel data dataframe.
Let's analyze this.
Firstly, let's see correlation.
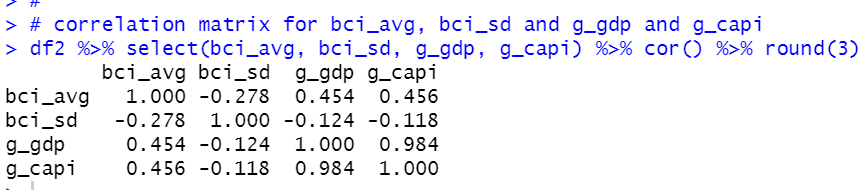
g_gdp and g_capi are highly correlated. bci_sd are negatively correlated to others.
Let's make a linear regression model that explaines bci_avg with bci_sd and g_gdp.
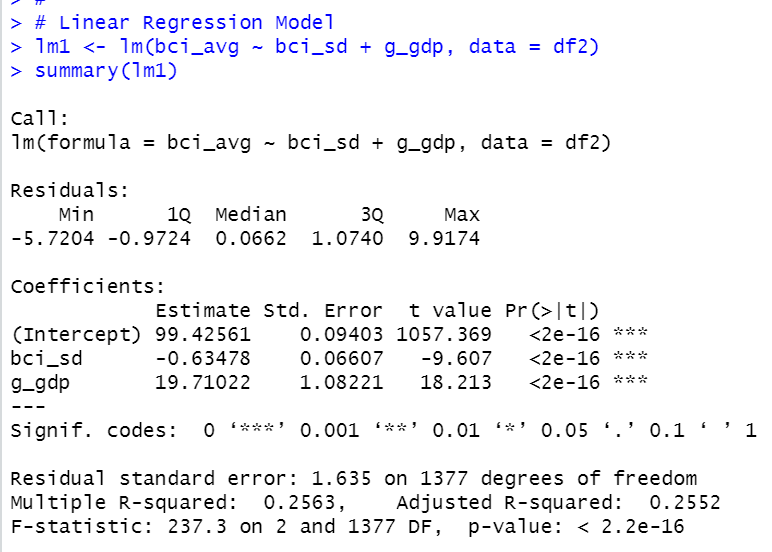
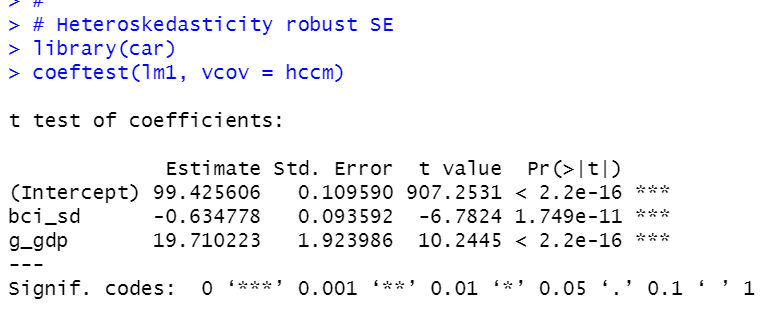
If bci_sd increase by 1, bci_avg decrease by -0.63. If g_gdp increase by 0.01, bci_avg increase by 0.197.
Let's check if there is heteroskedasticity for error terms.
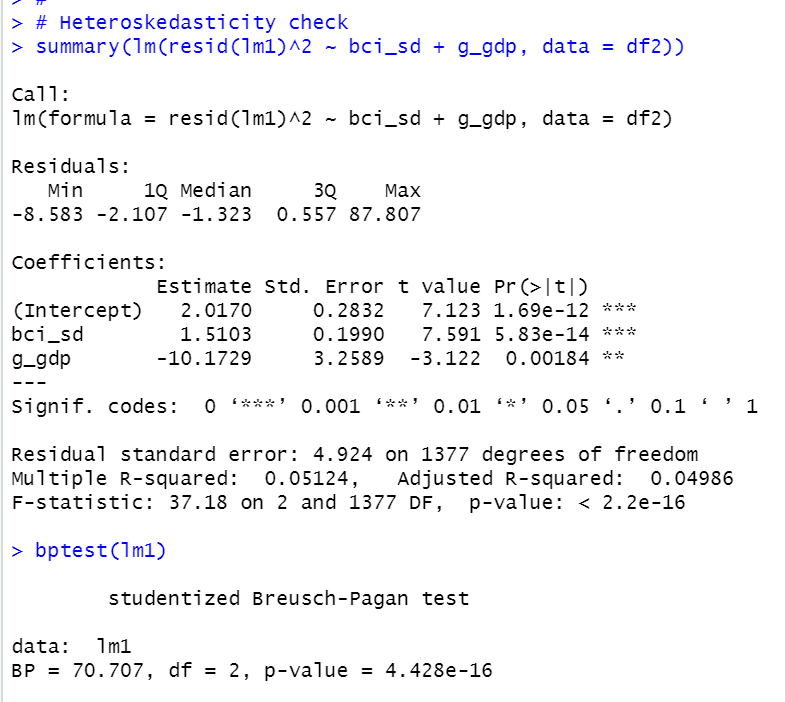
I did manuall checking and using bptest(). The both meshod shows there is heteroskedasticity.
Let's see residuals plot chart.
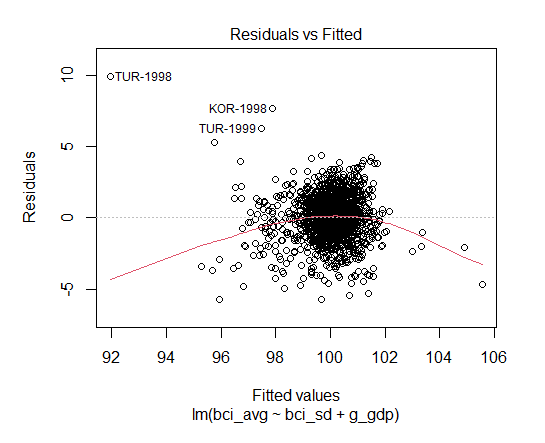
Since there is heteroskedasticity, we need heteroskedasticity-robust SE.
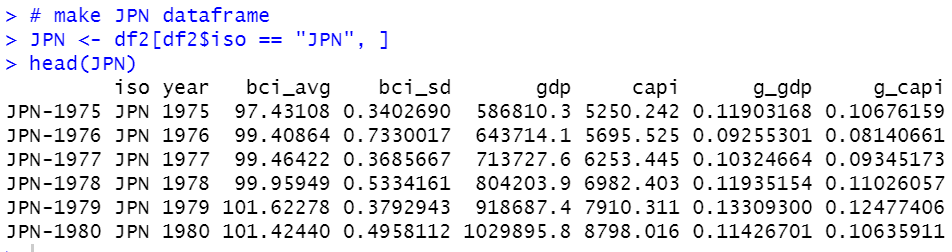
Let's see how well lm1 model matches actual data for JPN data.
1. I made JPN dataframe
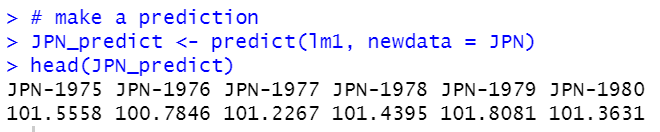
2. I made predicted bci_avg with predict() function.
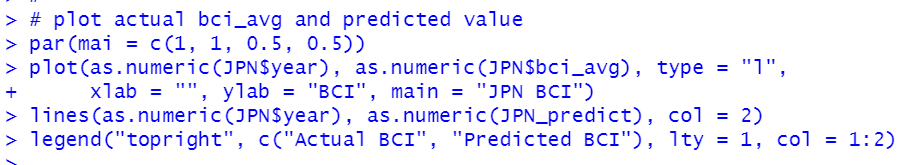
3. plot actual bci_avg and predicted value.
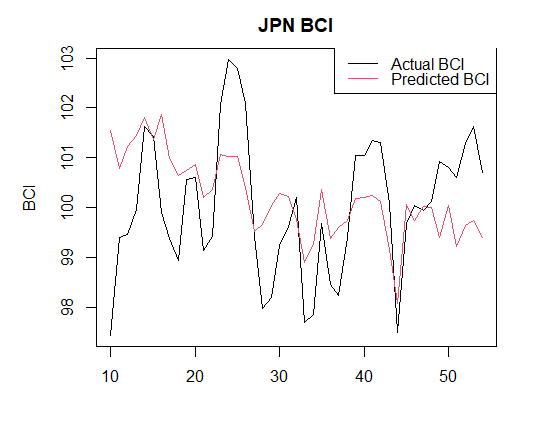
It seems not good fitting.
That's it.Thank you!
To read from the 1st post,