
Photo by Samuel Mwamburi on Unsplash
This post is following of above post.
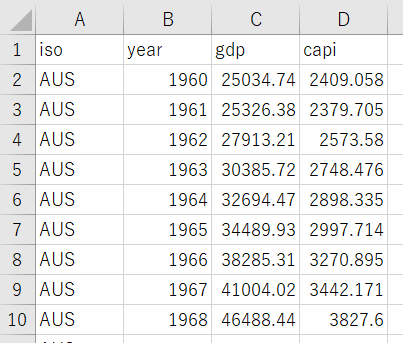
I have GDP and per capita GDP data file like below.
Let's use this data too.
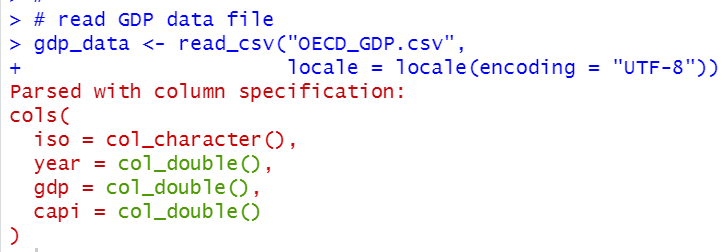
I load this data with read_csv() function.
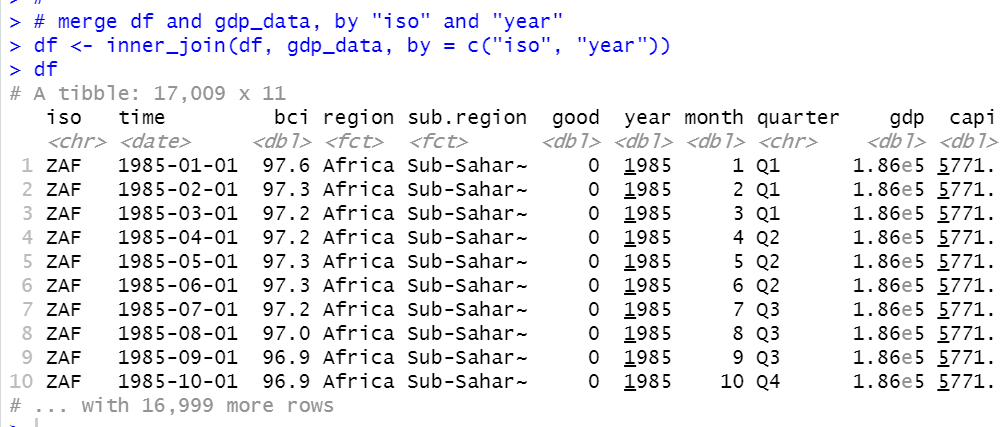
Then, I will merge gdp_data dataframe and df dataframe using inner_join() function.
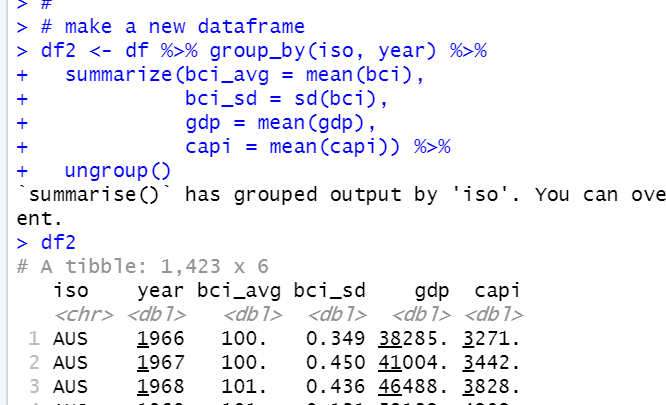
Then, I will make a new dataframe grouped by iso and year.
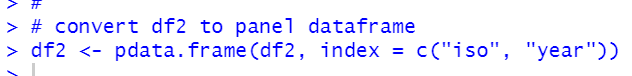
Then, I will convert df2 to panel dataframe.
I load plm package.

Then, I use pdata.frame() function.
pdim() function shows df2 dimension.
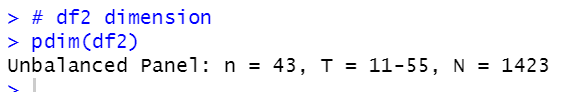
df2 is unbalanced panel data, there is 43 countries and minimum years is 11 and maximum years is 55.
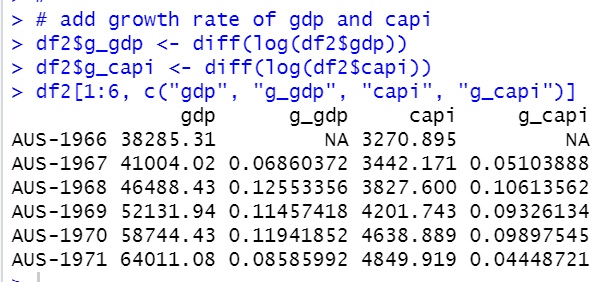
I add gdp growth rate and capi growth rate, I use difference of logarithm.
Let's confirm it worked fine.
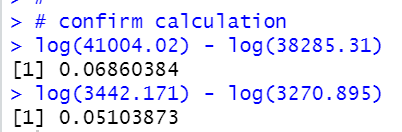
AUS-1967 gdp is 41004.02 and AUS-1966 gdp is 38385.31, so log(41004.02) - log(38285.31) = 0.6860, it is the same as AUS-1967 g_gdp.
I use na.omit() function to delete NA rows.
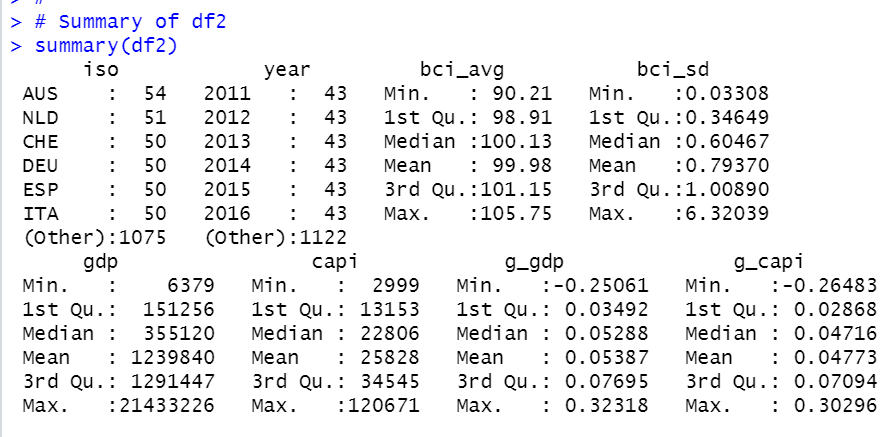
Let' see summary of df2.
That's it. Thank you!
Next post is
To read from the first post,