
Photo by Juliane Liebermann on Unsplash
This post is following of above post.
Now, let's see df dataframe object again.
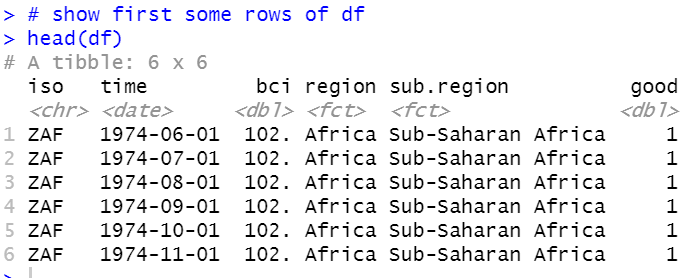
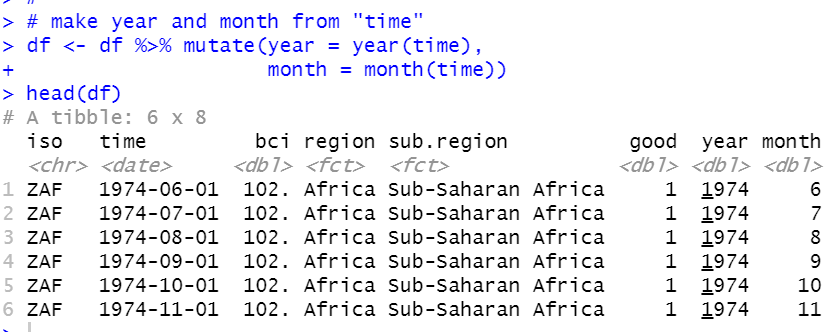
df have "time" variable as Date class. I will make year and month from time.
I need lubridate package.
Then, I use year() function and month(function).
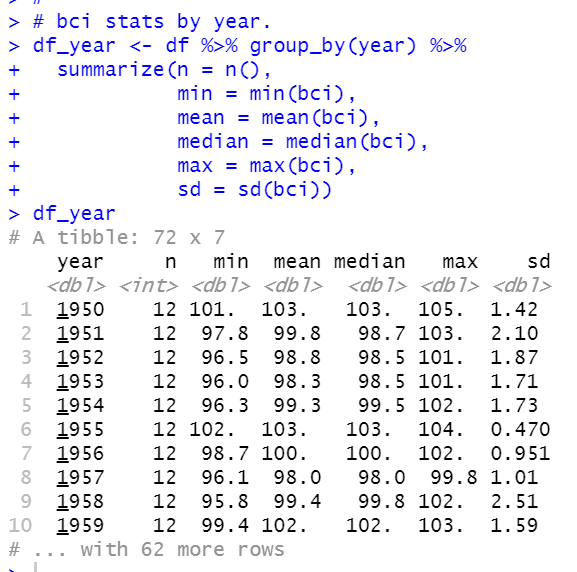
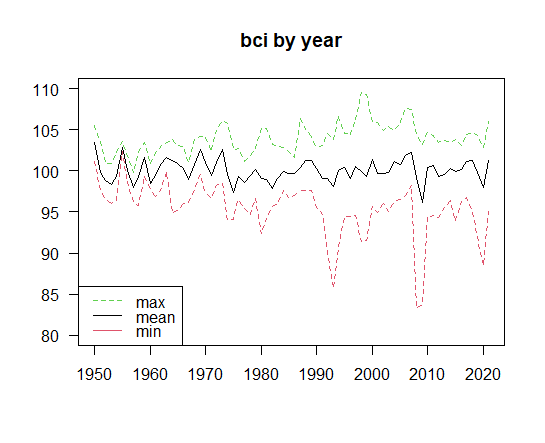
Let's calculate bci summary statistics by year.
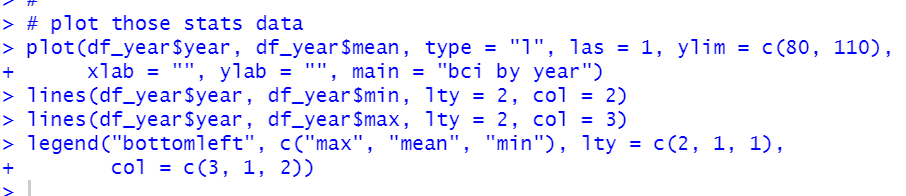
Let's plot those data.
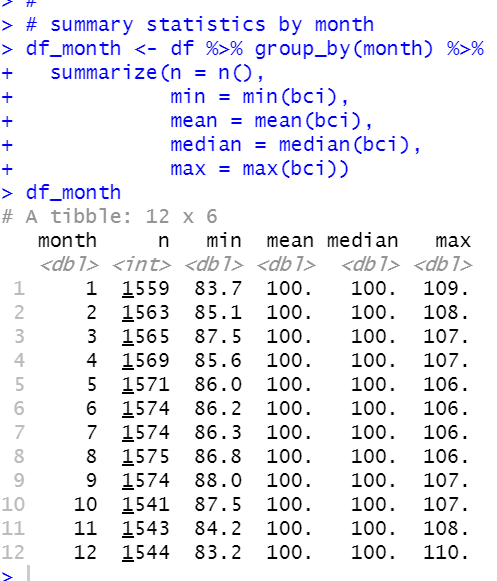
Let's calculate summary statistics by month.
I would like to mode decimal places for mean and median.
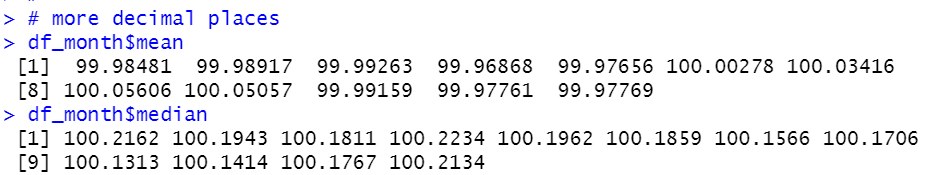
For mean, June, July, August and September are above 100.
Let's do ANOVA analysis to check if there is significant differnece by month.
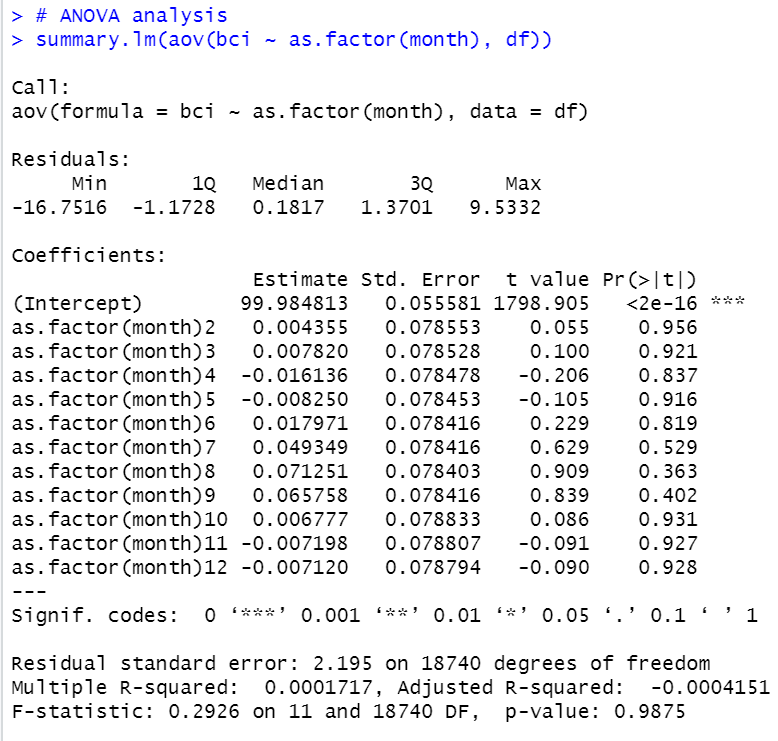
p-value is 0.9875. So we cannot reject null hypothese. null is "there is significant differnece by month.".
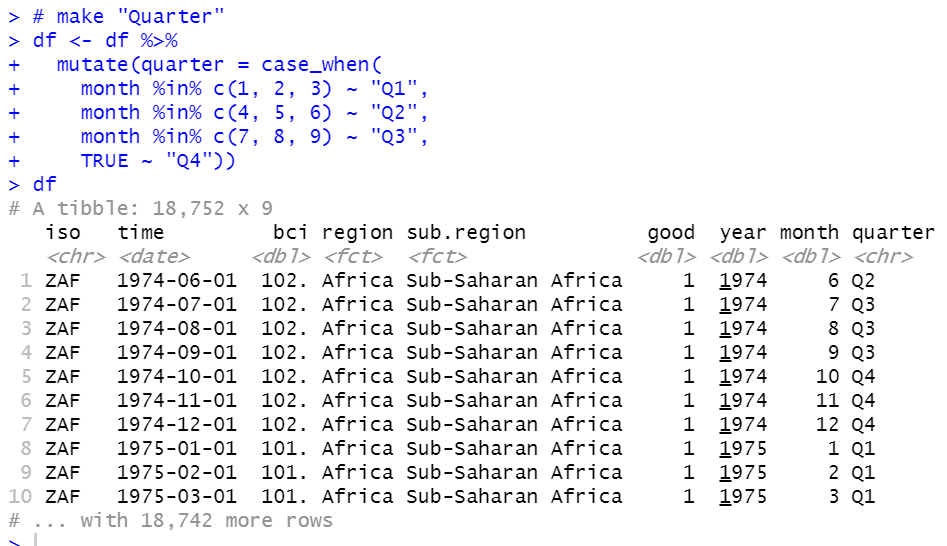
How about quarter?
January, February and March is the 1st Quarter,
April, May and June is the 2nd Quarter,
July, August and September is the 3rd Quarter,
October, November and December is 4th Quarter.
I use case_when() function to make quarter variable.
Let's do ANOVA by quarter.
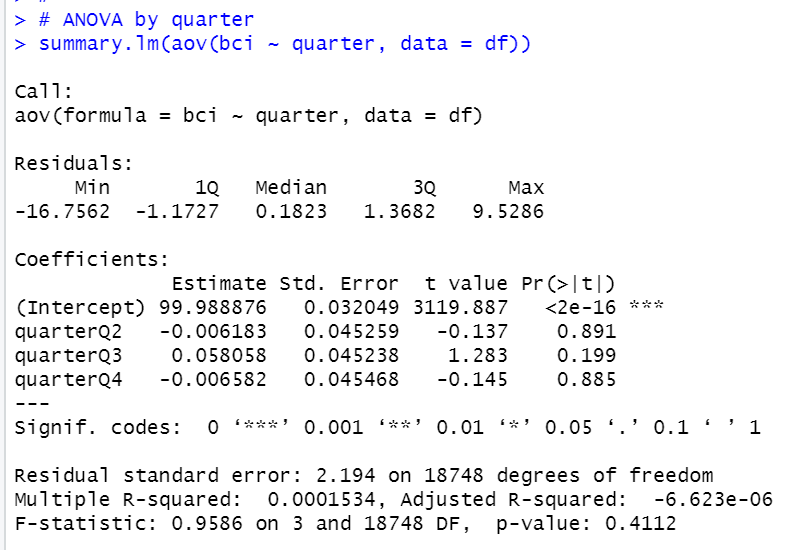
p-value is 0.4112. So there is no quarterly seasonality for BCI.
That's all. Thank you!
Next post is
To read from the 1st post,