
This post is following of above post.
I have another CSV flile like below.
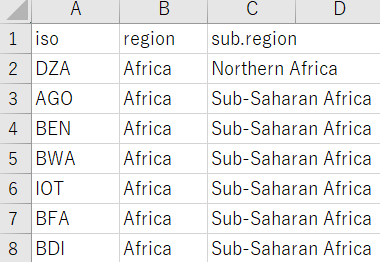
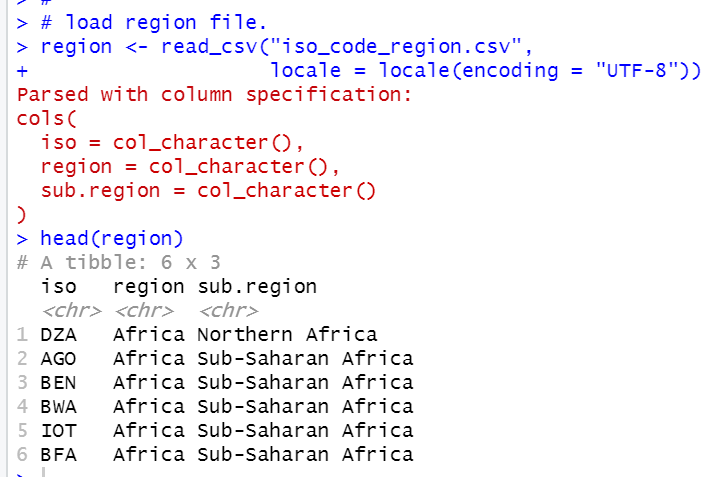
I read this file too.
Let' merge this dataframe and previous dataframe.

I convert region and sub.region to factor class.

Since Business confidence Index means good if it is greater than 100, I made bernouil variables, good.

Let's see summary of df again.
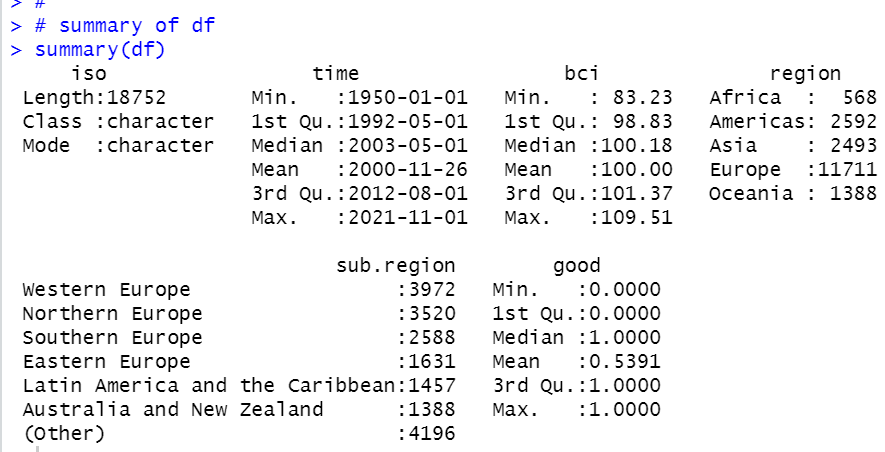
Mean of good is 0.5391, it means 53.91% observations are above 100 bci.
Let's see bci average and good by region.
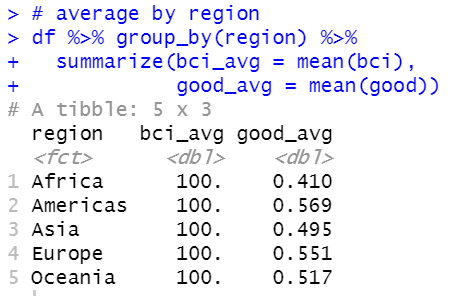
It is interesting that some regions have above 0.5 good_avg some have below 0.5 while all regions have the same bci_avg, 100. Americas has the highest good_acg, 0.569 and Africa has the lowest good_avg, 0.410.
Let's see by sub.region average.
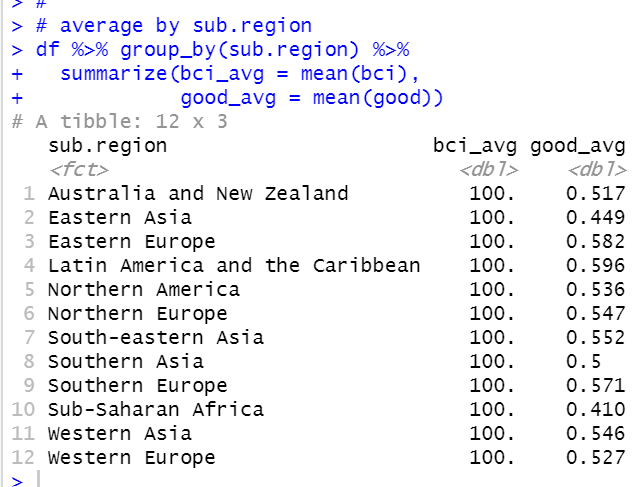
Again, bci average is 100 for all sub.region.
Let's make boxplot for bci by region.

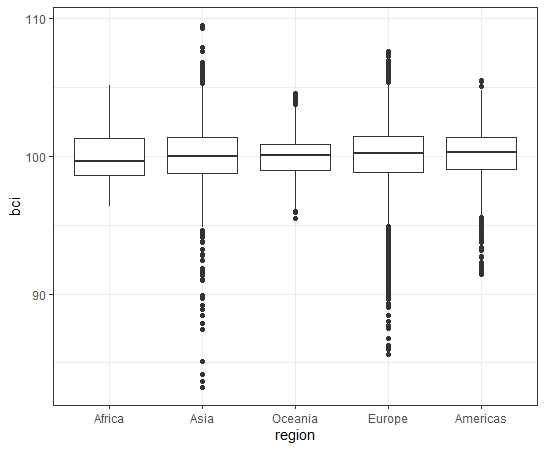
We see Asia has the most varaince and Africa has the least variance.
Let's see bci boxplot by sub.region

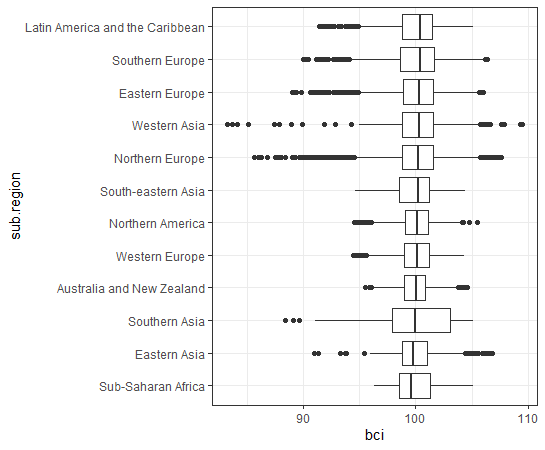
Western-Asia has the most variance.
That's it. Thank you!
Next post is
To read from the 1st post,