
UnsplashのSina Baharが撮影した写真
www.crosshyou.info
This post is followiing of the above post.
In this post, I will make wider format data frame from "df" data frame object.
First, let's see "df" data frame.
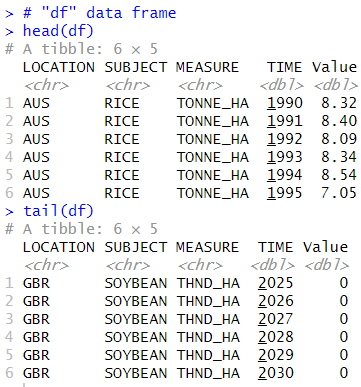
I see SUBJECT variable has 4 kinds of values, MAIZE, RICE, WHEAT and CORN, MEASURE variable has 3 koids of values, TONNE_HA, THND_HA and THND_TONNE.
So, actually, this data has 4 * 3 = 12 kinds of values.
I will make a data frame which have those each 12 variables.
I use pivot_wider() function.
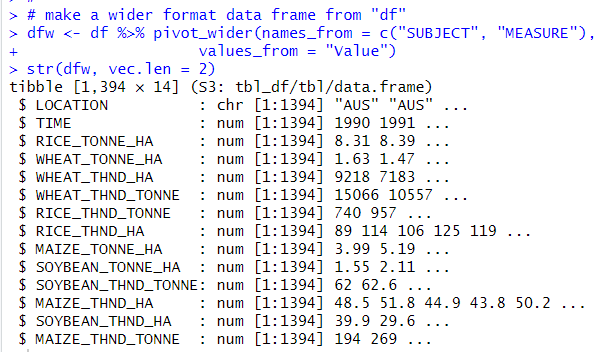
Now, I made a new data frame named "dfw" which has LOCATION, TIME and those 12 variables.
I use rename function to rename each variables to more simple names.
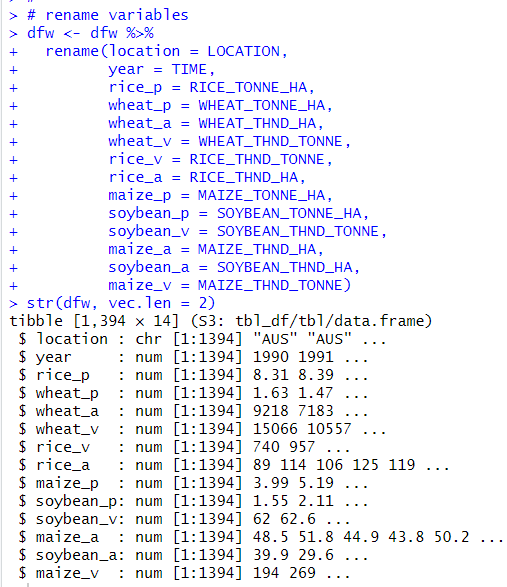
"_p" means productivity, TONNE_HA.
"_a" means field area, THND_HA.
"_v" means crop volume, THND_TONNE.
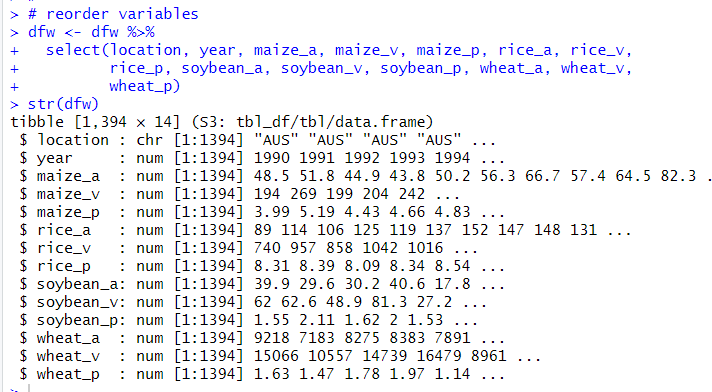
Next, I use select() to reorder variables.
Next, I converted location class to factor from character using as.factor() function.
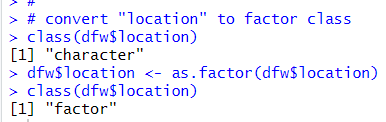
All right, now I completed converting long format data frame "df" to wide format data frame "dfw".
Let's use summary() function to see basic statistics.
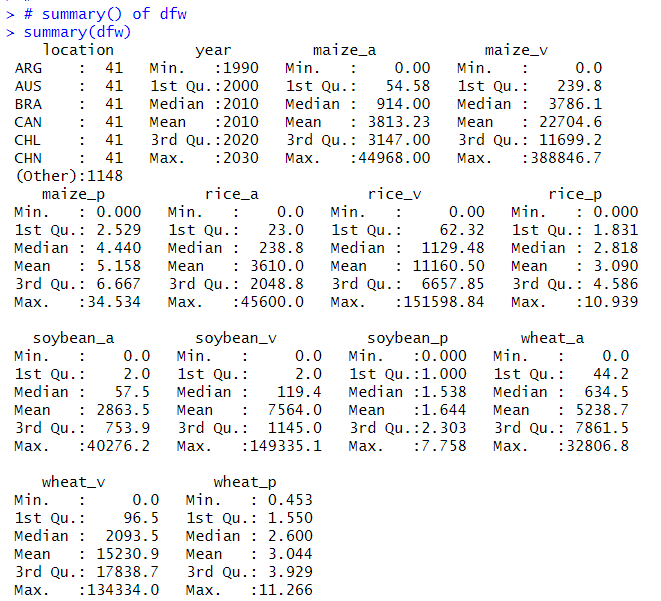
I see each variables have 0 value.
Wheat has the largest crop field. Maize has the largest crop volume, Maize has the highest productivity.
That's it. Thank you!
Next post is
To read from the first post,