UnsplashのAnisur Rahmanが撮影した写真
This post is followoing of the above post.
In this post I will do ANOVA analysis with "infer" package using R.
I would like to see crop production are different by crop, maize, rice, soybean and wheat.
I check there summary statisitics.

For averages, maize is 6.0, rice is 3.4, soybean is 1.7 and wheat is 3.3. So there seems different.
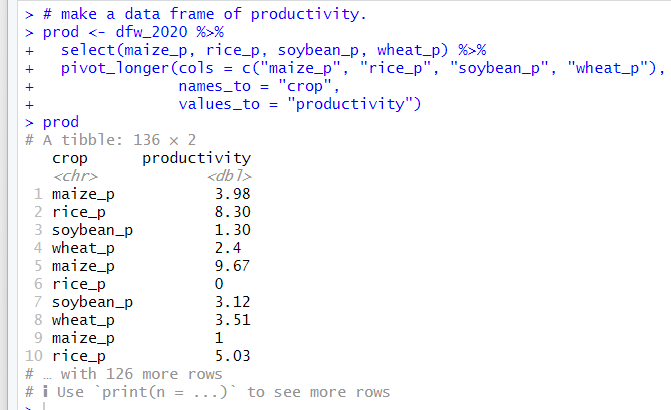
Before doing ANOVA, let's make a data frame using pivot_longer() function.

Let's see boxplots.


It seems there must be difference among crops.
I will using "infer" package workflow for ANOVA analysis, it means not theoretical formula based analysis but computer simulation based analysis.
I will do the same way as Tidy ANOVA (Analysis of Variance) with infer • infer
I load "infer" package.

I calculate observed F statistic.

F statistic is 14.1.
Next, I generate the null distribution of F statistics.

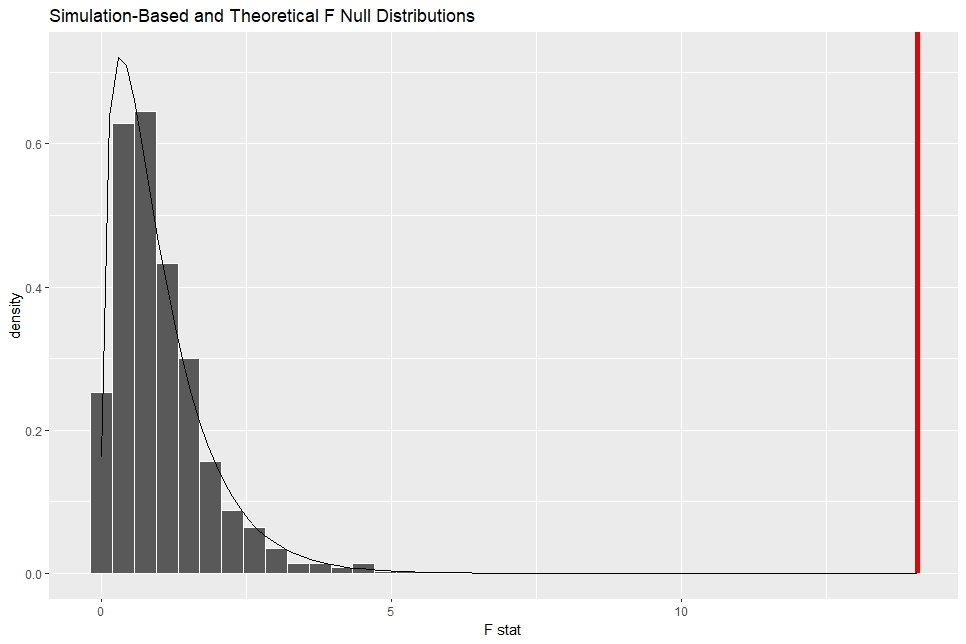
Let's visualize the null distribution and observed F statistic.


I see the observed F statistic is far away from the null distribution.
We can make the theoretical null distribution using assume() function.

The theoretical F distribution is 3 and 132 degrees of freedom distribution.
Let's visualize the theoretical F distribution and the observed F statistic.


I see the observed F statistic is far away too.
If I put method = "both" in visualize() function, I will see the both distributiom, simulation based and theoretical based.


Then, calculate p-value from the simulation null distribution.

The p-value is almost 0.
We can use pf() funtion to get p-value with theoretical formula.

We can use aov() function for theoretical(formula) based ANOVA.

p-values are almost 0, so I can reject the NULL hypothesis, crop productivity are all the same among maize, rice, soubean and wheat.
That's it. Thank you!
To read from the 1st post,