
Generated by Bing Inage Creator: Photo of tulips and cherry blossomes in the moon.
This post is following of above post.
In this post, I will do regression using R's 'rpart' package.
I learned how to use 'rpart' package from How to Fit Classification and Regression Trees in R (statology.org)
I use df_summary_time data frame.

I use 'avg' for explained variable and rest of variables excluding n are explanatory variables.
First, I divide df_summary_time into two data frames, one is for training, the other is for testing.

Let's see sumary statistic of the both data frames.

I don't see large difference abut avg for the both data frames.
Then, let's use 'rpart' package.
I load necessary packages.

rpart.plot package is for drawing decision tree plot.
First, I make a large decision tree with rpart() function.

Let's see the results with printcp() function.

I see CP = 0.00001 has the smallest xerror value; 0.23184. So I use 0.00001 for the final tree. I use prune() function.

Let's see the plot of the result.

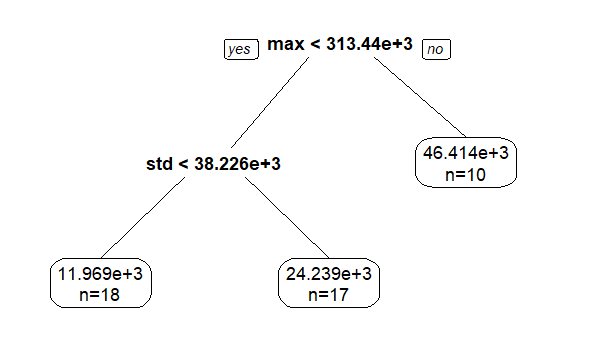
The result is using max and std only.
Let's see how the model fits with test data.

Let's make scatter plot for prediced and actual value.


Let's calculate MSE(Mean Squared Error).

To check this MSE is good or bad, I also use linear regression with lm().

MSE based by linear model is 26729, which is much smaller than rpart's decision tree.
Let's see scatter plot.


linear model makes good predictions.
Let's see summary.

Adjusted R-squared is 0.9998.
That's it. Thak you!
To read the psot series from the 1st post,