Generated by Bing Image Creator: Glossy abelia flowers in the beautiful green grass field, blue sky and white clouds, well feeling breeze, photo
This post is following of the above post. In this post, I will do tree model classification using R.
First, I make a new data frame for classification.

I make income to binary variable, HL and Mid. HL is High Income and Low Income groups, Mid is Mid income groups. Also, I converted region variavle from string to numeric.
Next, I make variable standardized.

I use Max - Min method.
Let's use boxplot to see relationship between income and other variables.
First, income and Y2006.


I see HL has larget Y2006.
Next, income and Chg_Net.


I see Mid group has larger income.
Next, I divided df3 data frame into two data frames, one is for training, the other is for testing.

Let's check proportion of income.

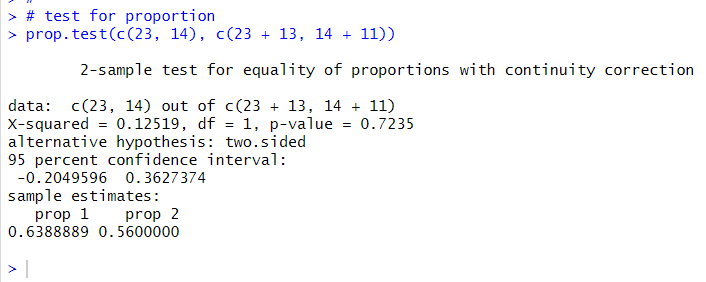
I use prop.test() function to check the two data frame proportion is statistically different or not.

p-value is 0.7235, which is very large. I cannot reject null hypothesis: two proportion is same.
All right, let's move on classification. I use rpart() function in rpart package.

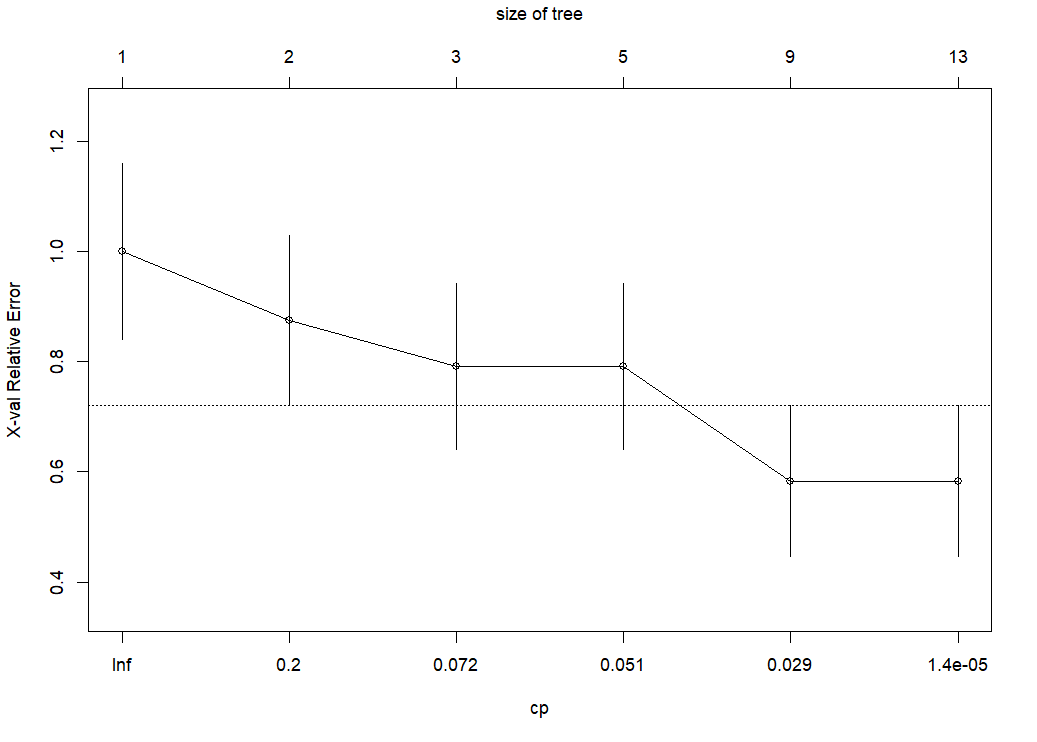
Let's make a cp plot.


I prune with cp = 0.029.

Visualize the tree.


Predict income using test data.

Let's make a contingency table to see how crrectly the tree model predict.

The tree model mistakes only 2.
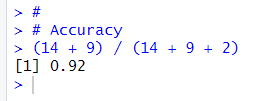
The accuracy is (14 + 9) / (14 + 9 + 2) = 92%.

That's it. Thank you!
To read from the first post,