Bing Image Creator で生成: long bird's view of great rainforest river, photo

今回からしばらくは、UCI Machine Learning Repositry の Bike Sharing のデータを分析してみようと思います。
Fanaee-T, H. (2013). Bike Sharing [Dataset]. UCI Machine Learning Repository. https://doi.org/10.24432/C5W894.
まずは、データをダウンロードしました。
CSVファイルは2つありました。1時間ごとに集計したファイルと、1日ごとに集計したファイルです。今回は1日ごとに集計したファイルを使います。

こういうのです。
それぞれの変数の説明は以下になります。
- instant: record index
- dteday : date
- season : season (1:springer, 2:summer, 3:fall, 4:winter)
- yr : year (0: 2011, 1:2012)
- mnth : month ( 1 to 12)
- holiday : weather day is holiday or not (extracted from http://dchr.dc.gov/page/holiday-schedule)
- weekday : day of the week
- workingday : if day is neither weekend nor holiday is 1, otherwise is 0.
+ weathersit :
- 1: Clear, Few clouds, Partly cloudy, Partly cloudy
- 2: Mist + Cloudy, Mist + Broken clouds, Mist + Few clouds, Mist
- 3: Light Snow, Light Rain + Thunderstorm + Scattered clouds, Light Rain + Scattered clouds
- 4: Heavy Rain + Ice Pallets + Thunderstorm + Mist, Snow + Fog
- temp : Normalized temperature in Celsius. The values are divided to 41 (max)
- atemp: Normalized feeling temperature in Celsius. The values are divided to 50 (max)
- hum: Normalized humidity. The values are divided to 100 (max)
- windspeed: Normalized wind speed. The values are divided to 67 (max)
- casual: count of casual users
- registered: count of registered users
- cnt: count of total rental bikes including both casual and registered
cnt というレンタルされたバイクの数が被説明変数で、これを予測する回帰分析です。
まず、tidyverse パッケージの読み込みをします。

read_csv() 関数で CSV ファイルを読み込みます。

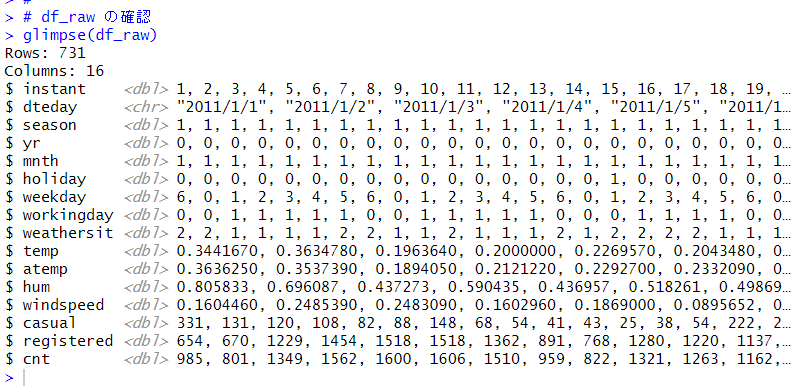
731 の観測データがあり、16の変数があります。dteday だけ文字列のデータで、後は全て数値データとなっています。
glimpse() 関数で df_raw を確認します。

変数の説明をよく読むと、instant はただの ID 番号、mnth は 1 ~ 12 のカテゴリカル変数、season は 1 なら春、2 なら夏などのカテゴリカル変数、1 ならwethersit は 1, 2, 3, 4 のカテゴリカル変数、などとなっていますので、とりあえず、必要でない変数は削除して、カテゴリカル変数はダミー変数に変換してみます。

カテゴリカル変数は、ファクター型にするほうが簡単ですが、全部数値型のデータにしたほうが、あとでいろいろと処理がしやすそうなので、今回は全部、ダミー変数にしてみました。
summary() 関数で出来上がったデータフレームをみてみます。


うまくできました。
説明変数の cnt がどのような推移を示しているか、チャートを描きましょう。


冬のシーズンは、利用者が少ないことや、2011年よりも2012年のほうが利用者が多いことがわかります。
今回は以上です。
次回は
です。
今回のコードは以下になります。
#
# tidyverse パッケージの読み込み
library(tidyverse)
#
# CSV ファイルの読み込み
df_raw <- read_csv("bike_sharing.csv")
#
# df_raw の確認
glimpse(df_raw)
#
# df_raw を整形
df <- df_raw |>
select(-instant, -casual, - registered) |> # 不要な変数を削除
mutate(dteday = ymd(dteday)) |> # 日付型に変換
# season から summer, fall, winter のダミー変数を作成
mutate(
summer = if_else(season == 2, 1, 0),
fall = if_else(season == 3, 1, 0),
winter = if_else(season == 4, 1, 0)
) |>
select(-season) |> # season はもう必要ないので削除
rename(y2012 = yr) |> # yr を y2012に名前変更
# mnth から Decmber を基準にしてダミー変数を作成
mutate(
jan = if_else(mnth == 1, 1, 0),
feb = if_else(mnth == 2, 1, 0),
mar = if_else(mnth == 3, 1, 0),
apr = if_else(mnth == 4, 1, 0),
may = if_else(mnth == 5, 1, 0),
jun = if_else(mnth == 6, 1, 0),
jul = if_else(mnth == 7, 1, 0),
aug = if_else(mnth == 8, 1, 0),
sep = if_else(mnth == 9, 1, 0),
oct = if_else(mnth == 10, 1, 0),
nov = if_else(mnth == 11, 1, 0)
) |>
select(-mnth) |> # mnth はもう必要ないので削除
# weekday から sunday(0) を基準にダミー変数を作成
mutate(
sat = if_else(weekday == 6, 1, 0),
mon = if_else(weekday == 1, 1, 0),
tue = if_else(weekday == 2, 1, 0),
wed = if_else(weekday == 3, 1, 0),
thu = if_else(weekday == 4, 1, 0),
fri = if_else(weekday == 5, 1, 0)
) |>
select(-weekday) |> # weekday はもう必要ないので削除
# weathersit から 4 を基準にダミー変数を作成
mutate(
w1 = if_else(weathersit == 1, 1, 0),
w2 = if_else(weathersit == 2, 1, 0),
w3 = if_else(weathersit == 3, 1, 0)
) |>
select(-weathersit) # weathersit はもう必要ないので削除
#
# summary() 関数
summary(df)
#
# cnt の推移
df |>
ggplot(aes(x = dteday, y = cnt)) +
geom_line()
#