www.crosshyou.info

政府統計の総合窓口のデータや、OECDやUCIやのデータを使って、Rの練習をしています。ときどき、読書記録も載せています。

短時間労働者の給与のデータの分析10 - R言語のmgcv::gam関数でGeneralized Additive Model, e1071::svm関数でSupport Vector Machine Model


www.crosshyou.info

の続きです。

mgcvパッケージの読み込みをしてgam関数をつかって、generlized additive modelを作って男性、女性を予測してみます。
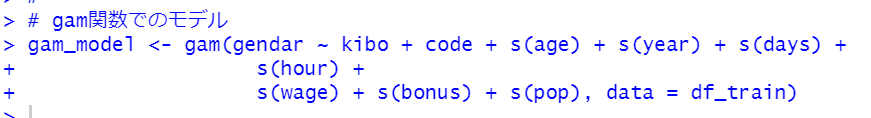
 

f:id:cross_hyou:20210417094707p:plain

gam関数をつかってモデルを作ります。

f:id:cross_hyou:20210417094828p:plain

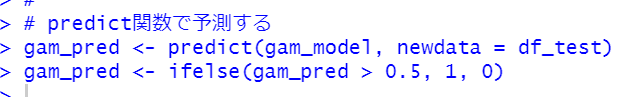
このモデルでpredict関数を使い予測してみましょう。

f:id:cross_hyou:20210417094937p:plain

confusionMatrix関数で結果と正解率を出します。
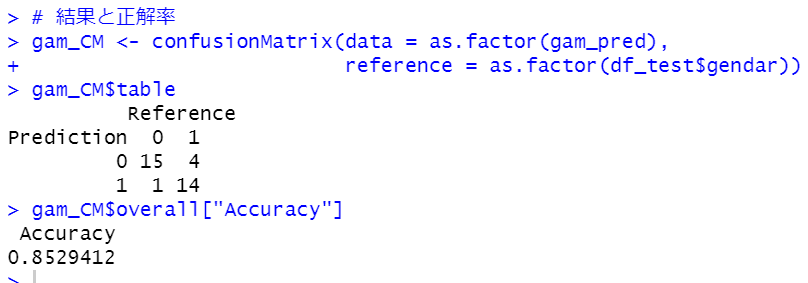
f:id:cross_hyou:20210417095121p:plain

正解率は85%です。

summary関数でこのモデルを見てみます。

f:id:cross_hyou:20210417100355p:plain

f:id:cross_hyou:20210417100411p:plain

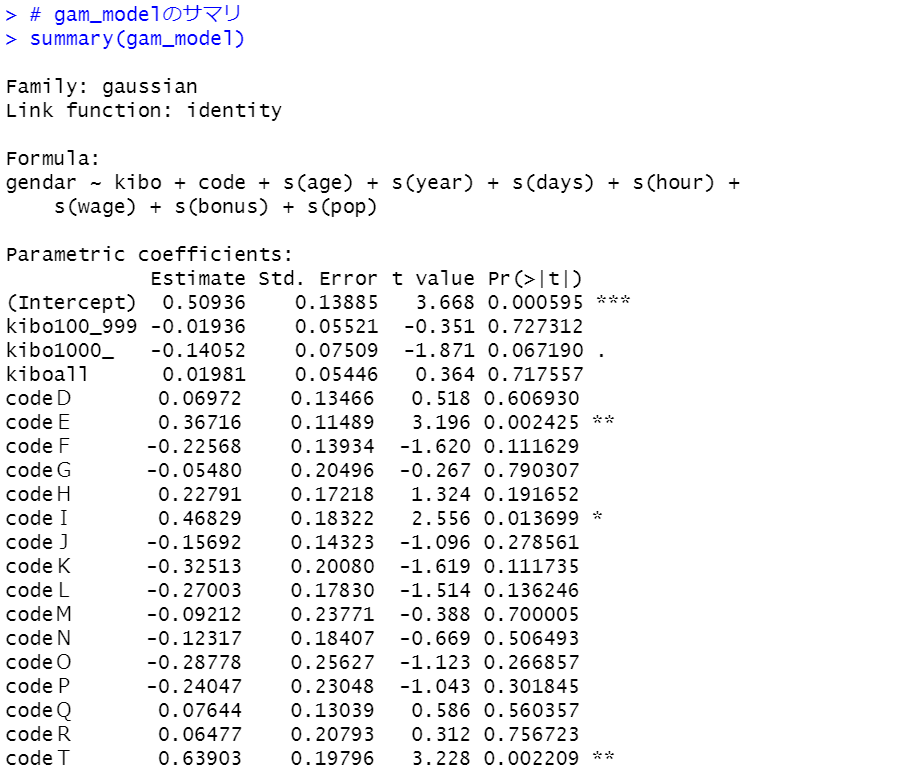
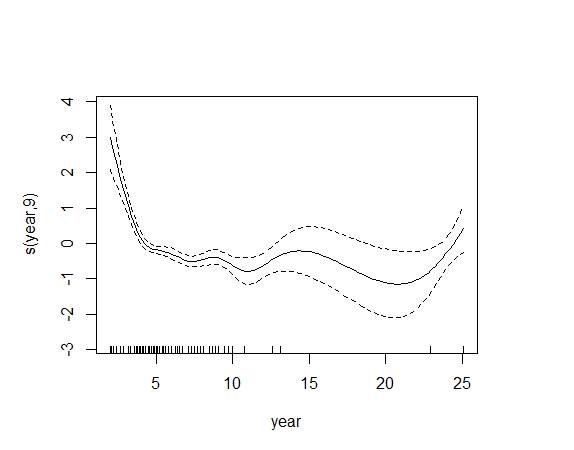
s(year)のedfの値が9で一番大きいです。一番yearがぐにゃぐにゃしているということですね。百聞は一見に如かず。plot関数でグラフにしてみます。

f:id:cross_hyou:20210417101221p:plain

f:id:cross_hyou:20210417101235p:plain

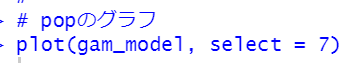
edfが1のpopもグラフにしてみます。

f:id:cross_hyou:20210417101448p:plain

f:id:cross_hyou:20210417101502p:plain

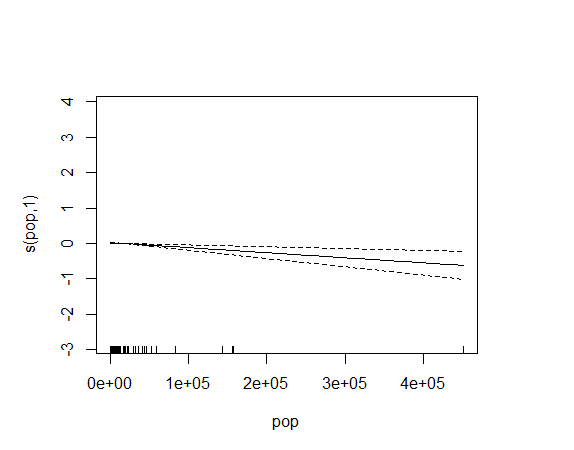
つぎにe1071パッケージの読み込みをして、svm関数でsupport vector machineモデルで予測してみます。

f:id:cross_hyou:20210417102658p:plain

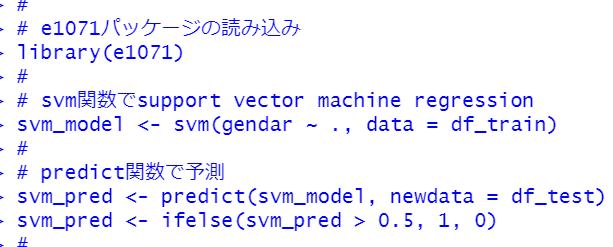
confusionMatrix関数で結果と正解率をみてみます。

f:id:cross_hyou:20210417102739p:plain

正解率は76%でした。

今回は以上です。

はじめから読むには、


www.crosshyou.info

 です。