
Photo by Wengang Zhai on Unsplash
In this blog, I will analyzie OECD Net ODA data

I got data from OECD web site.

This is what the CSV file looks like.
I use R for data analysis.
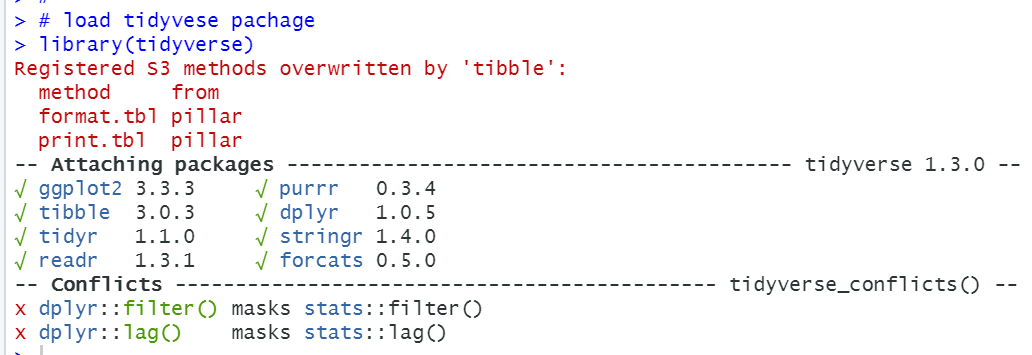
Firstly, I load tidyverse package.
Next, use read_csv() function to read CSV file.

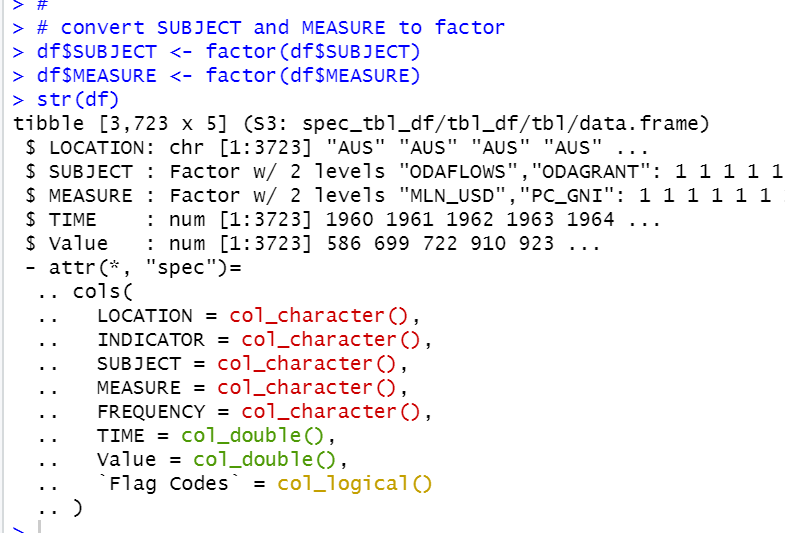
We see LOCATION, INDICATOR, SUBJECT, MEASURE, FREQUENCY are character.
TIME and Value are numeric.
'Flag Codes' is logical.
Let's use table() function to see how many elements character type variables have.

For LOCATION, we see a lot of locations and max observation number is 128.

We see INDICATOR and FREQUENCY have just one value and 'Flag Codes' has no value.
So, we can delete those variables.
And we see SUBJECT and MEASURE have two values.
So, we can convert them to factor.

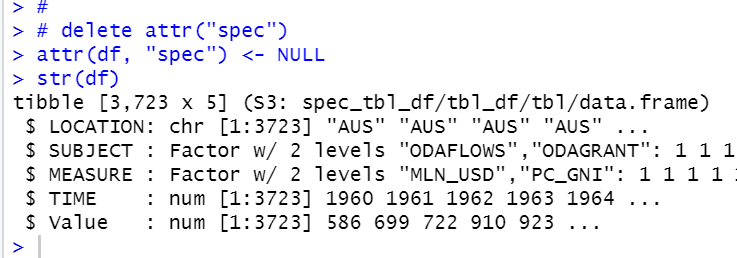
I delete attr("spec") to make df simpler.
I convert variable names to lower case.
I use tolower() function

All right. That's it in this blog.
Thank you!
Next blog is