
Photo by Greg Rosenke on Unsplash
HistDataパッケージのBowleyデータをみてみます。
これは、一番初めに書かれた統計の教科書の一つ、Arthur Bowley(1901)のなかで使われているデータで、イギリスとアイルランドの輸出データの時系列データです。
Arthur Bowleyはこの時系列データをグラフにして、移動平均線を表示してるそうです。
データを呼び出してみます。
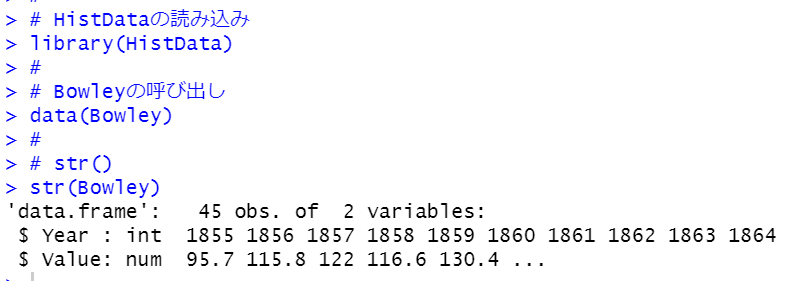
str()関数でBowleyのデータ構造を調べたところ、45行、2列のデータフレームで、
Yearという名前の変数と、Valueという名前の変数があることがわかります。
Yearは西暦で、Valueが輸出の数量だか金額ですね。
早速、ヘルプに書かれているコードを実行してみましょう。
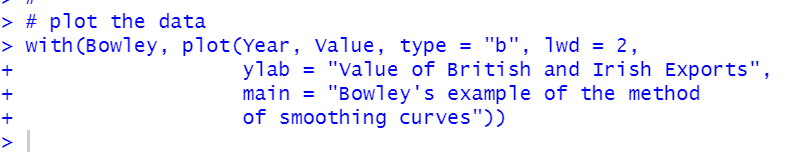
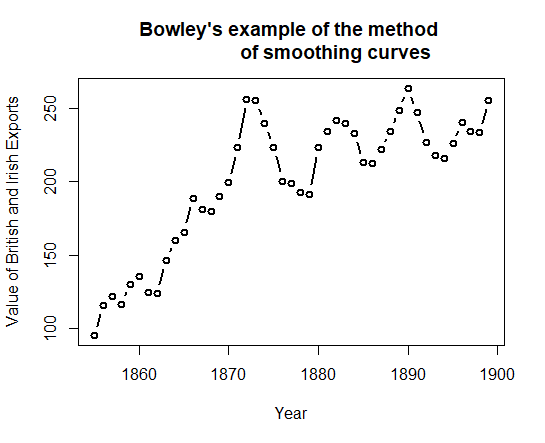
plot()関数で時系列のグラフを描きました。
続いてのコードはこれです。
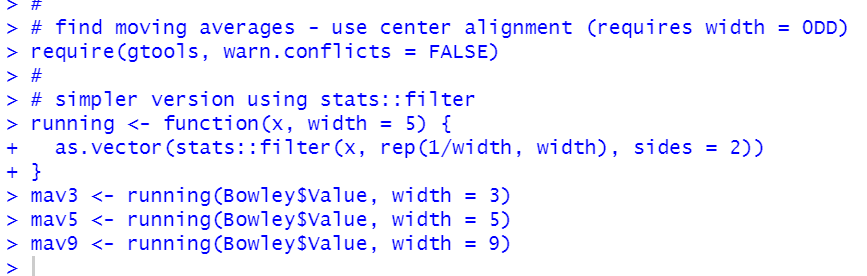
statsパッケージのfilter()関数で移動平均の値を計算します。runningという関数を作って、3年、5年、9年移動平均を作りました。
stats::filter(x, rep(1/width, width), sides = 2) というので、widthの値で移動平均の計算周期を調整するようです。
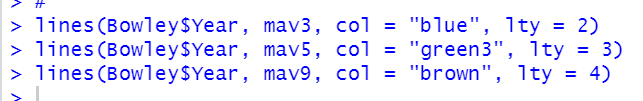
そして、この後、lines()関数で移動平均を描いたグラフに追加していきます。
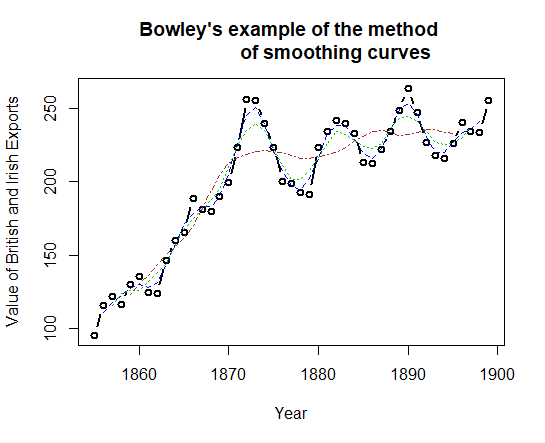
移動平均線が追加されました。
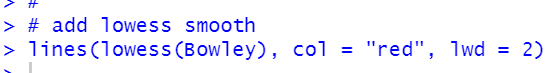
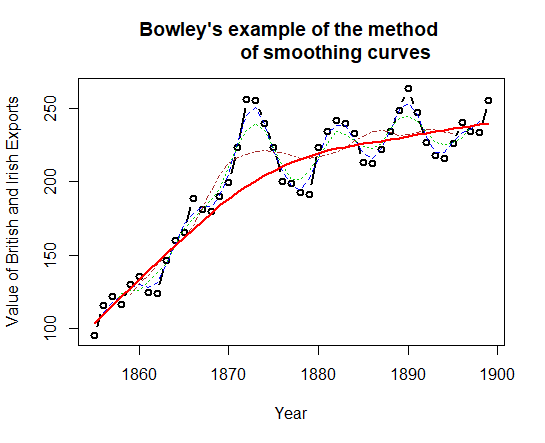
この後、lowess()関数で平滑化した線を追加しています。
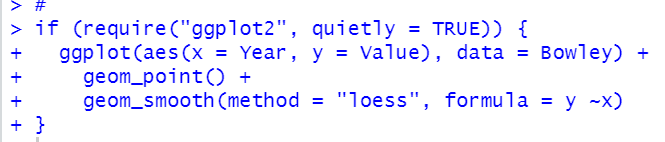
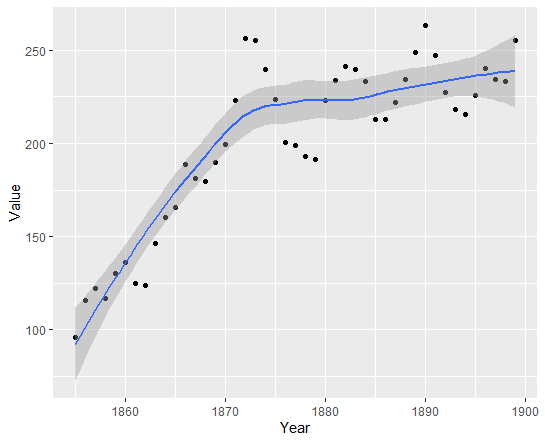
最後はggplot2()パッケージでグラフを描いています。
これでヘルプのコードは以上です。
以下が今回のコードです。
#
# HistDataの読み込み
library(HistData)
#
# Bowleyの呼び出し
data(Bowley)
#
# str()
str(Bowley)
#
# plot the data
with(Bowley, plot(Year, Value, type = "b", lwd = 2,
ylab = "Value of British and Irish Exports",
main = "Bowley's example of the method
of smoothing curves"))
#
# find moving averages - use center alignment (requires width = 0DD)
require(gtools, warn.conflicts = FALSE)
#
# simpler version using stats::filter
running <- function(x, width = 5) {
as.vector(stats::filter(x, rep(1/width, width), sides = 2))
}
mav3 <- running(Bowley$Value, width = 3)
mav5 <- running(Bowley$Value, width = 5)
mav9 <- running(Bowley$Value, width = 9)
#
lines(Bowley$Year, mav3, col = "blue", lty = 2)
lines(Bowley$Year, mav5, col = "green3", lty = 3)
lines(Bowley$Year, mav9, col = "brown", lty = 4)
#
# add lowess smooth
lines(lowess(Bowley), col = "red", lwd = 2)
#
if (require("ggplot2", quietly = TRUE)) {
ggplot(aes(x = Year, y = Value), data = Bowley) +
geom_point() +
geom_smooth(method = "loess", formula = y ~x)
}