
UnsplashのDaniel Pelaez Duqueが撮影した写真
This post is following of the above post. In the previous post, I did regression analysis with time-series data. Unfortunately, I cannot make a statistically significant model.
Now, I will make panel data in this post.
First, let's check which TIME has many observations.

I see 2018 and 2017 have 42 observations. I decide to use 2018 and 2008, 10 years before year.

2008 has 37 observations, so, some LOCATIONs have only one observation.
Let's check it.

COL, IND, NZL, RUS and ZAF are locations which has only 1 observation.
I remove those LOCATIONs.

Let's check whther I correctly removed those LOCATIONs.

All right, I successfully removed those LOCATIONs.
Then, I use plm package to make panel data frame.

I made a balanced panel data frame, n = 37, T = 2.
Let's see first few rows.

Let's see TRY histogram.

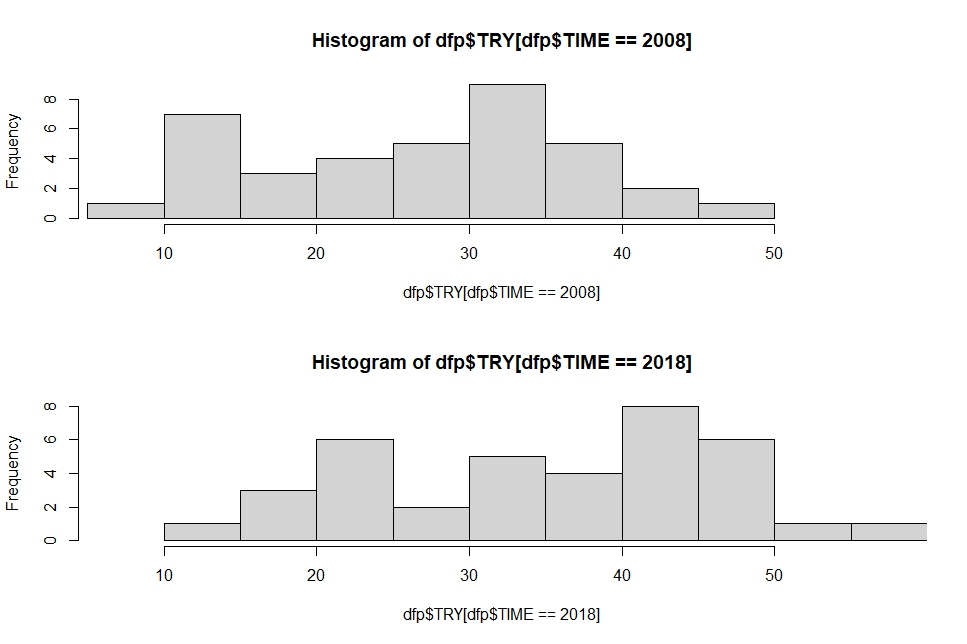
I see TRY distribution moved to right from 2008 to 2018. It means TRY has increased.
Let's see men_women histogram

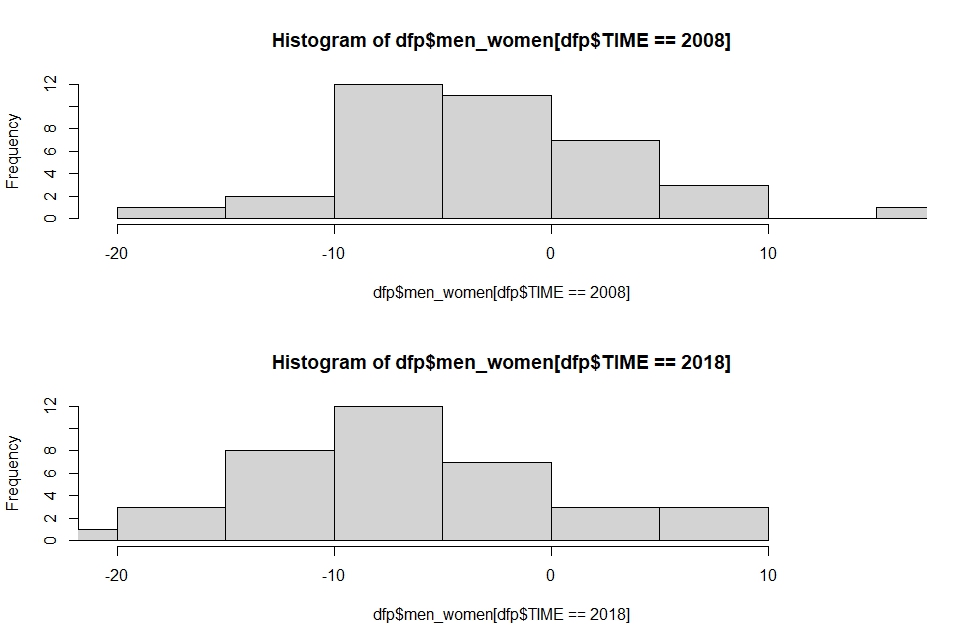
I see men_women distribution moved from right to left, it means men_women has decreased from 2008 to 2018.
Let's see l_usd_cap histogram.


I see l_usd_cap distribution moved from left to right, which means l_usd_cap has increased.
That's it. Thank you!
Next post is
To red from the 1st post,