
Photo by Jasper Wilde on Unsplash
This post is following og above post.
This time, let's see boxplot by region for 2021 data

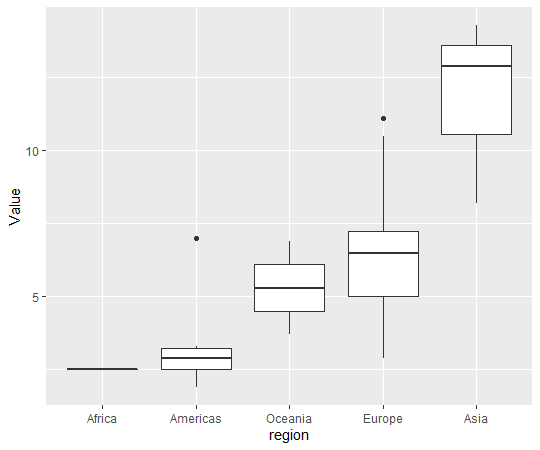
We see Asia region has the highest consultations and Afirica has the lowest.
Then, how about 2007 and 2012. Is there any significant change?

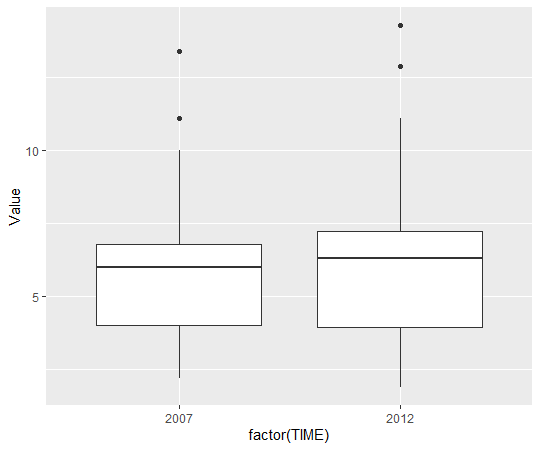
It seems there is not significant difference between 2007 and 2012.
Let's confirm it with t.test().
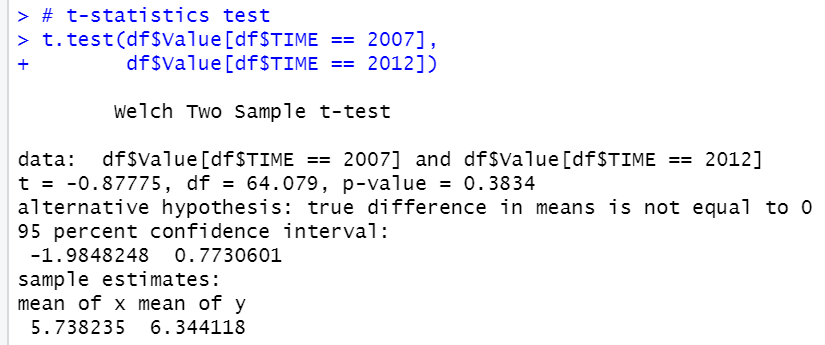
p-value shows 0.3834, 95% confidence interval is -1.98 ~ 0.77. This means there is not differnece between 2007 and 2012 at 95% confidence level.
Then, let's check it more closely. we know 2007 and 2012 has the same countries. So, let's see differnece of each country.
For example, see
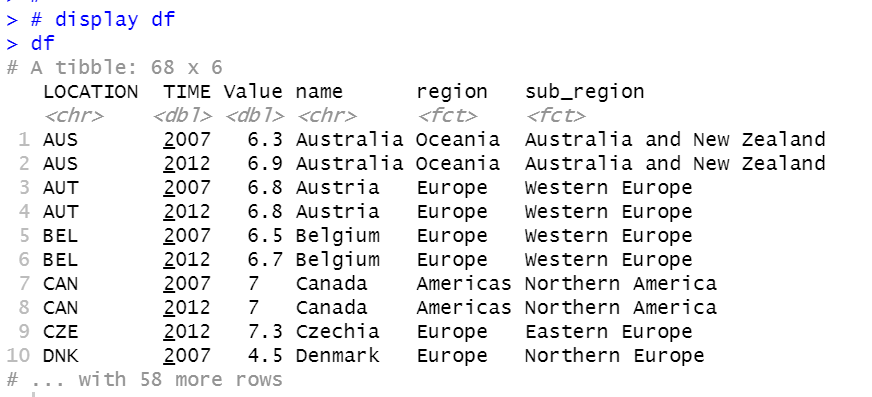
AUS has 6.3 for 2007 and 6.9 for 2012. So, AUS has 0.6(6.9 - 6.3) increase.
Let's calculate this 'increase'.
First, we will convert data frame to wide type.
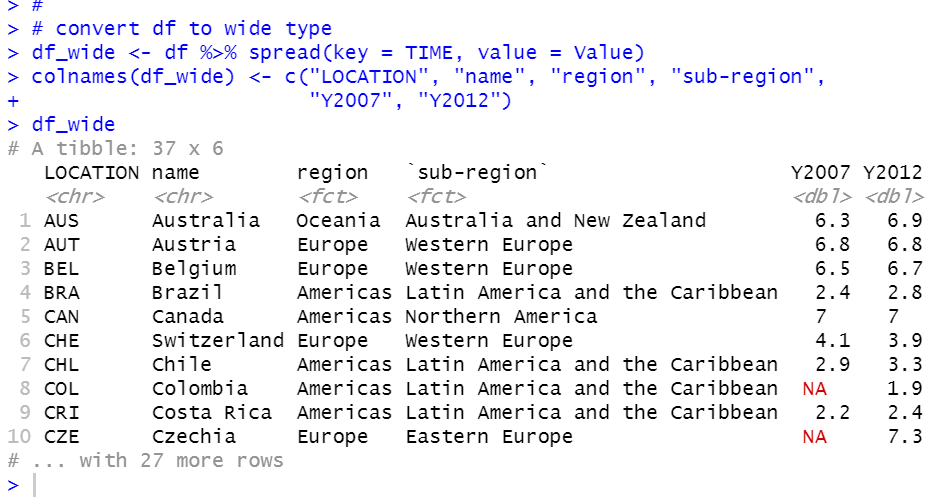
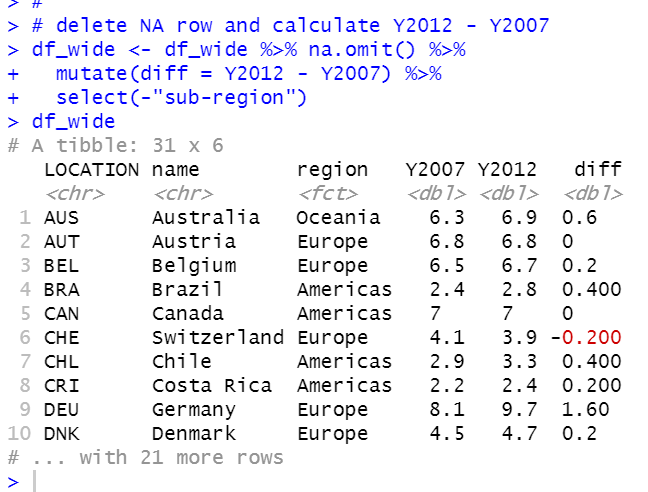
delete NA rows with na.omit() function and calculate Y2012 - Y2007 with mutate() function.
Then, let's see diff histogram

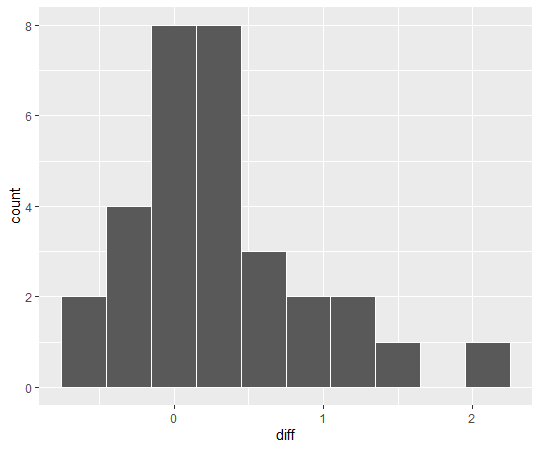
We see average diff seems greater than 0.
Let's conform it with t.test() function
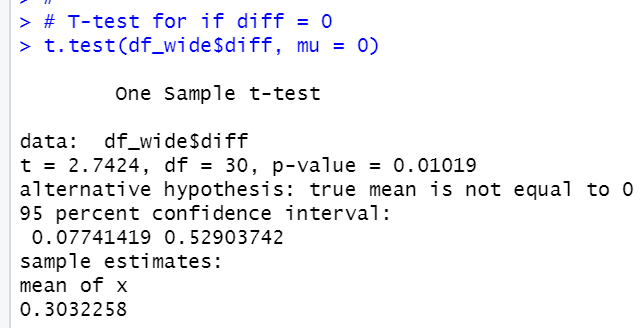
p-value = 0.01019, 95% confidence interval is 0.077 ~ 0.529.
So, diff is greater than 0 at 95% significance level.
We number of seedoctors' consultations has been inceased from 2007 to 2012.
That's it. Thank you!
Next post is...
To read the first post