
Photo by Jarand K. Løkeland on Unsplash
This blog is following of above blog.
In this post, let's see ODAFLOWS and PC_GNI data.
To begin with, let's see time trend.


I cannot see obvious trend.
Let's calculate average valur by year and make a plot.


Now, I see some trend. 1980 to 1990 are higher period.
Let's see a histogram.


I see right tale is long histogram.
What is the highest PC_GNI country and year?

2015 year Sweeden has the highest PC_GNI value.
How about average?

Norway has the highest average PC_GNI value.
What is the lowest value and year?

2010 year Thailand has the lowest value.
How about average value?
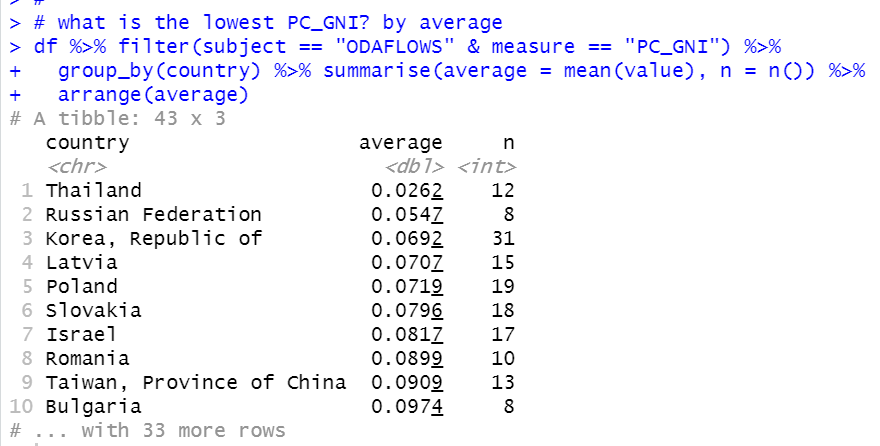
Thailand has the lowest average PC_GNI.
That's it. Thank you!
Next post is
To read the 1st post