
This post is following of above post.
In this post, I woll do time series data regression using R , dynlm package.
Firstly, I wll make time series data.
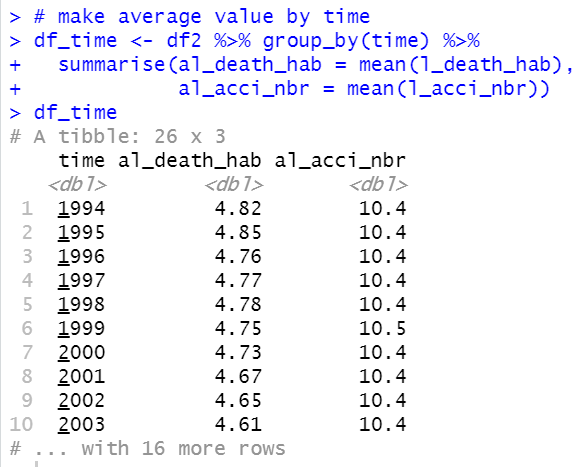
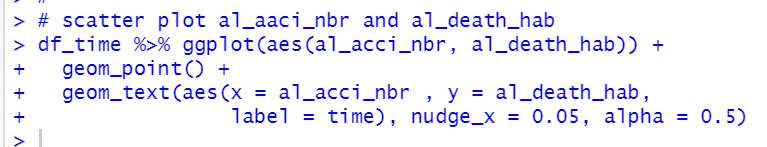
Then, let's see how data is looking. Let's make a scatter plot.
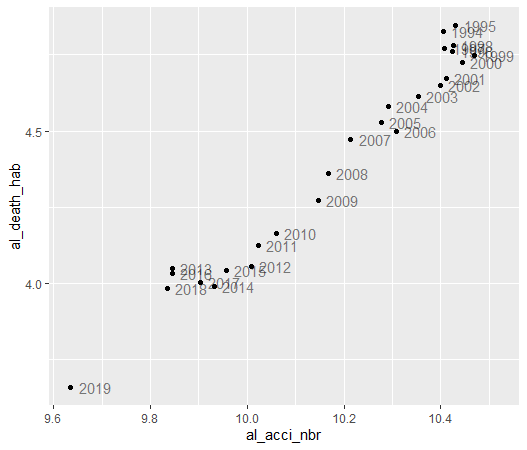
We see al_acci_nbr and al_death_hab are highly correlated and there seems time trend, the both data are declining year by year.
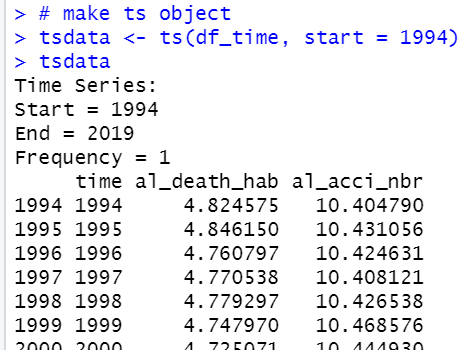
Next, we make ts object with ts() function
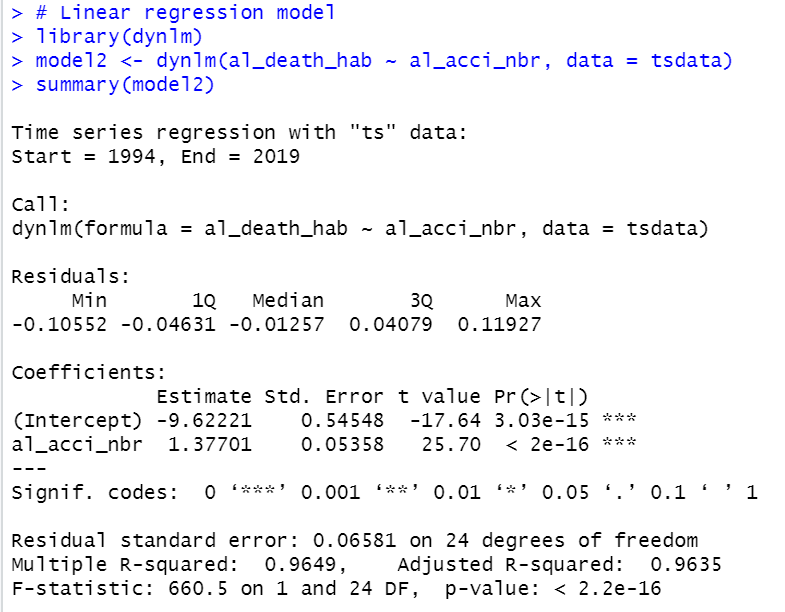
All right, we use dynlm package's dynlm() fundtion for time sereis data regression.
We can add time trend with trend(data).
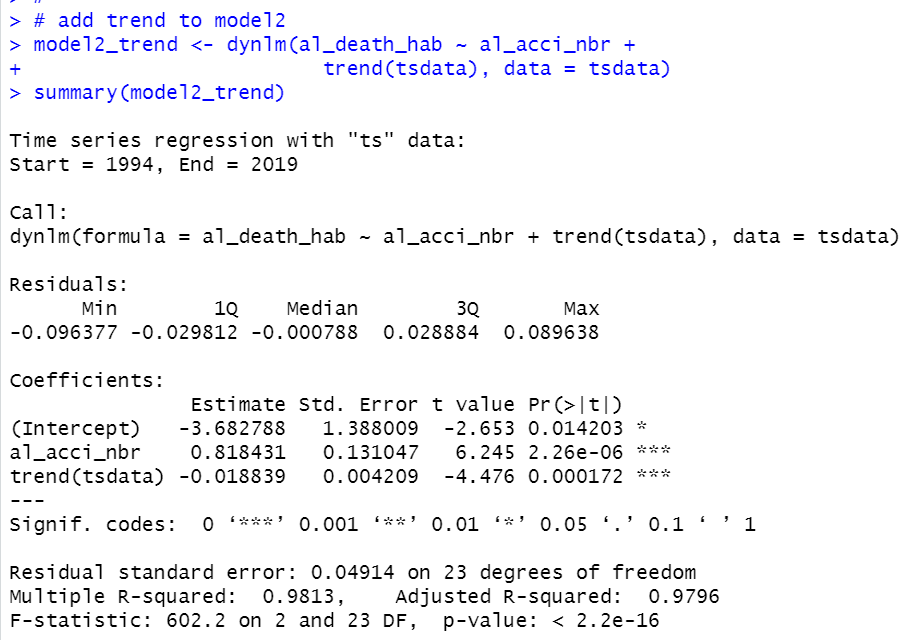
We see time trend:trend(tsdata) and al_acci_nbr are both statistically significant under 1% level.
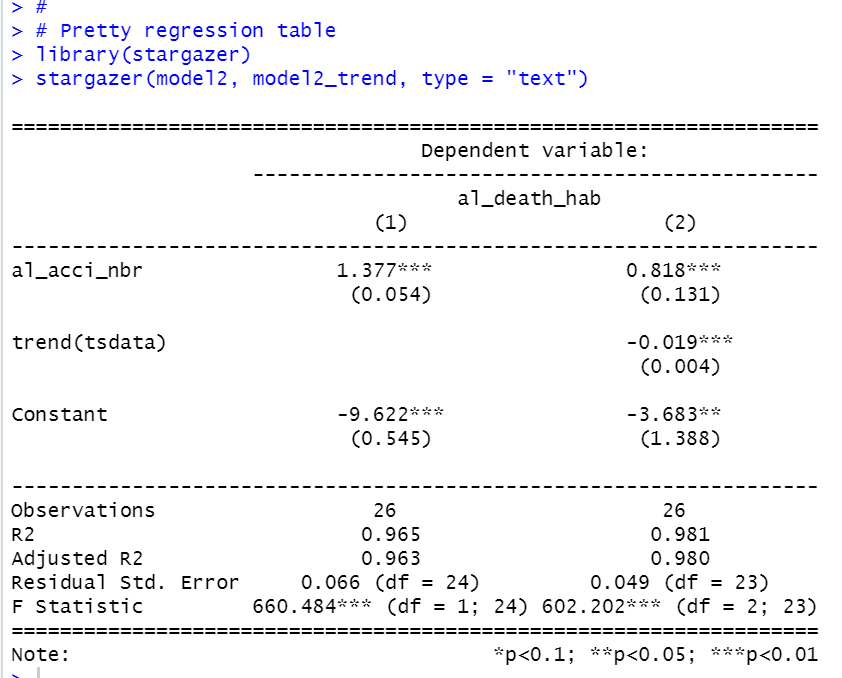
Let's make pretty regreesion table with stargazer package's stargazer() function.
That's it. Thank you!
To read 1st post,