
Photo by Stephen Leonardi on Unsplash
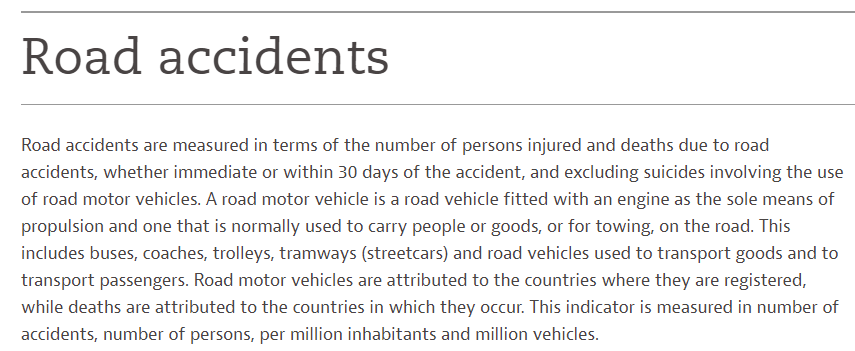
In this post, I will analyze OECD Road accidents data.
The CSV file I donwloaded from the OECD web site(Transport - Road accidents - OECD Data) is like below.
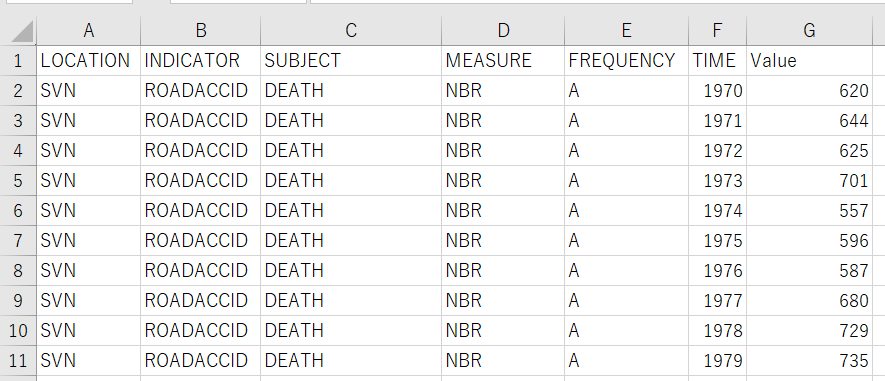
Let' analuze this data using R.
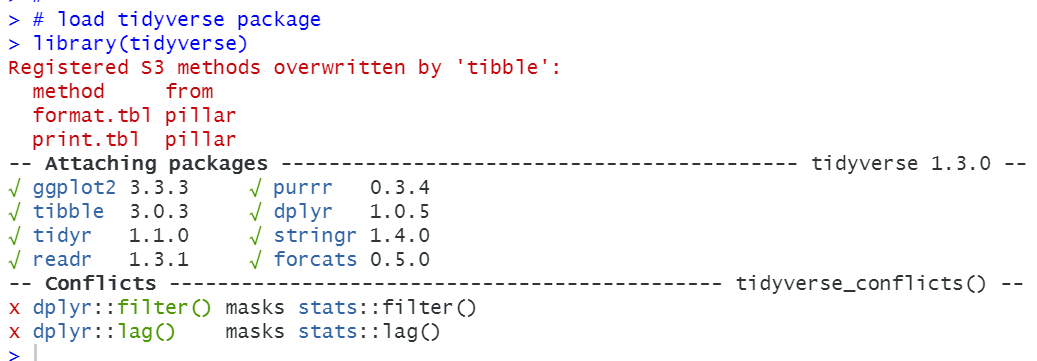
Firstly, I load tidyverse package.
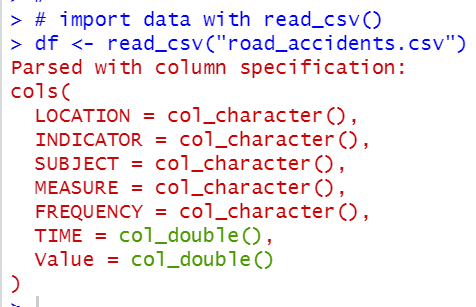
Then, let's use read_csv() function to import data into R.
Let's see each variables.
LOCATION

We see there are many LOCATIONs, it is ISO country code. So, I change variable names to iso.

INDICATOR

INDICATOR has just one value, ROADACCID. So I will remove INDICATOR from the data frame.

SUBJECT

SUBJECT has three kinds of value, DEATH, ACCIDENTCASUAL and INJURE, so I will convert SUBJECT to factor class.

MEASURE

MEASURE has three kinds of value. So I will change it to factor and rename them.
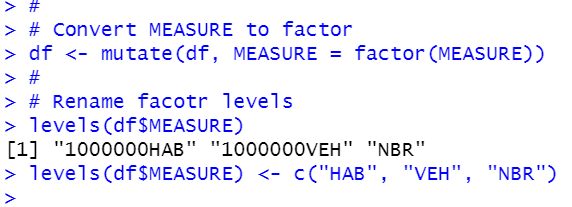

FREQUENCY has only one value, A. So I will remove from the data frame, df.

TIME

TIME is numeric value and there is no NA value. minimum value is 1970 and maximum value is 2019. TIME is year.
Value

Value is numeric variable and there is no NA.
I will convert data frame column name to lowercase.

All right, let's use summary() function to see data frame summary.
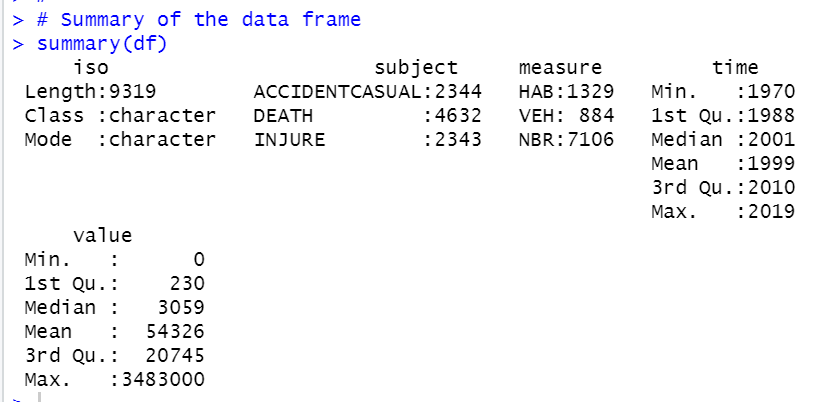
For subject ACCIDENTATCASUAL, it is too long. Let's make it short.

Let's see summary(df) again.

Great!
That's it. Thank you!
The next post is..