
UnsplashのMelanie Kreutzが撮影した写真
This post is following of the above post.
I will see time-seires trend of productivity of crop production data in this post.
I refrer to

First, I will make "ts" object from "dfw" data frame object.
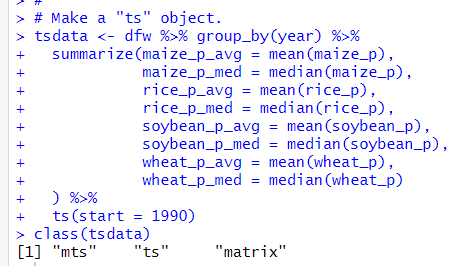
Then, I load "TSstudio" package to analyze "ts" class object.

I use ts_info() function to check "tsdata" object.

This "tsdata" object has 9 variables and 41 observations, starting with 1990 to 2030.
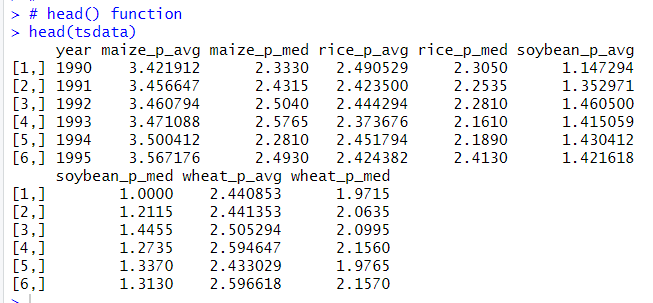
Let's see the first 6 observations with head() function.
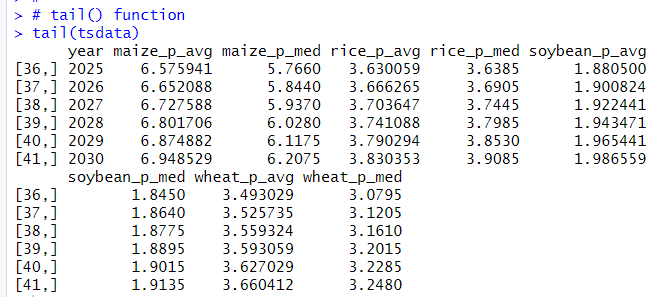
Let's see the last 6 observations with tail() function
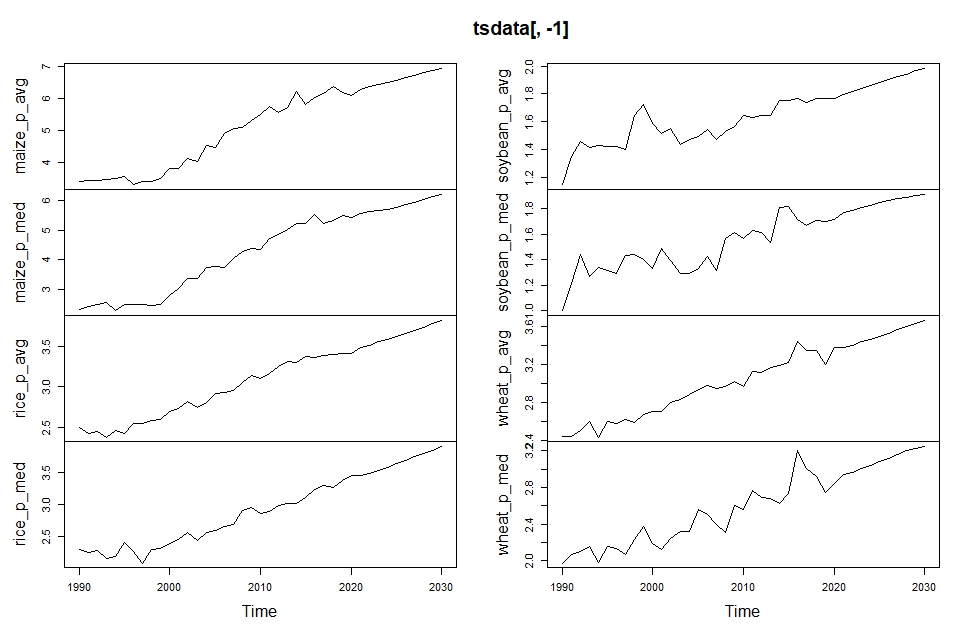
Let's visualize data with plot.ts() function.
![]()
TSstudio package has a nice visalizing function, ts_plot() function.


ts_plot() function can make interactive plots like above.
I see crop production has been increased over long years.
That's it. Thank you!
Next post is,
To read from the 1st post,