
Generated by Bing Image Creator
This post is following of the above post. In the above post, I visualize replacement rates of 2014 and 2020. And there seems no signficant difference.
In this post, let's confirm that using infer package of R.
First, let's get mean difference.
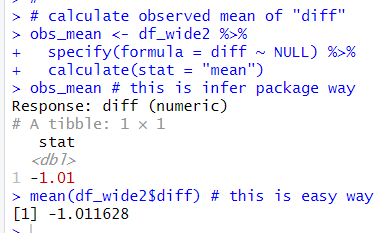
I see the mean "diff" is -1.01, I use infer package workflow and usual mean() function.
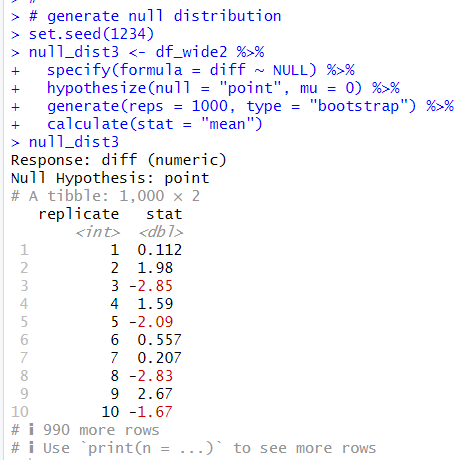
Next, let's make null distribution, null hypothesis is mean "diff" = 0.
Then, let's visualize p-value area.
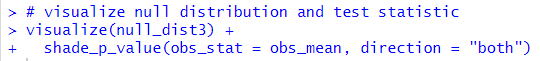
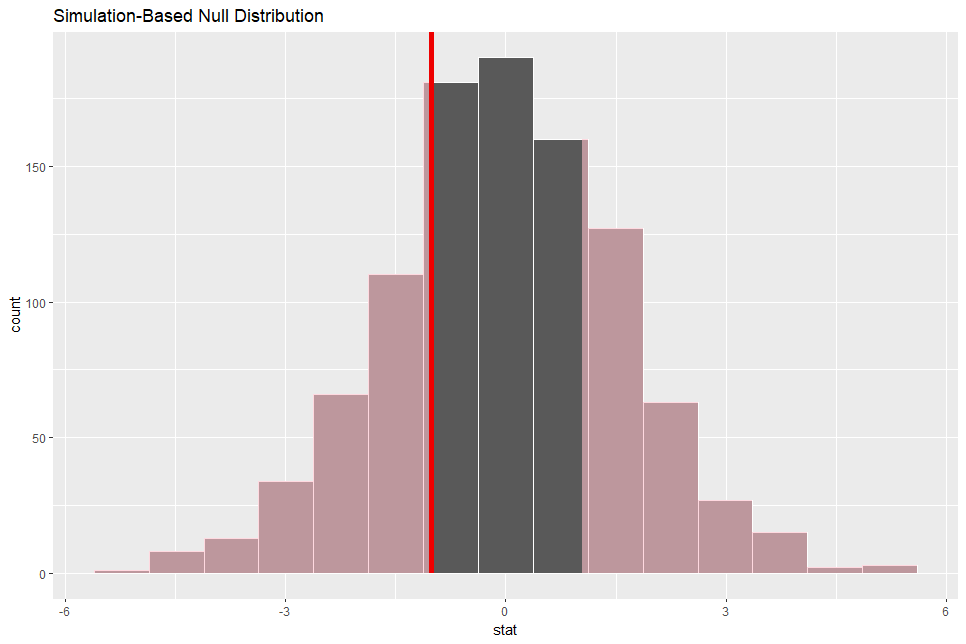
red shaded are is p-value area, it seems very wide.
Now, let's get p-value.
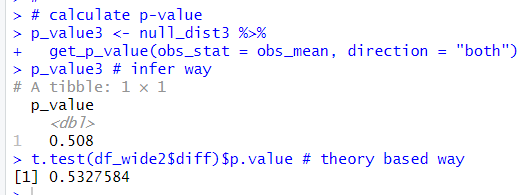
p-value using infer workflow, which is simulation based, is 0.508. The theory based p-value, which is using t.test() function, is 0.508. The both p-value is greater than 0.5. I failed to reject null hypothesis: the mean difference = 0.
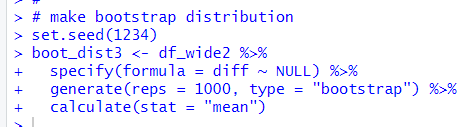
Next, let's make a bootstrap distribution.
Let's visualize it.
![]()
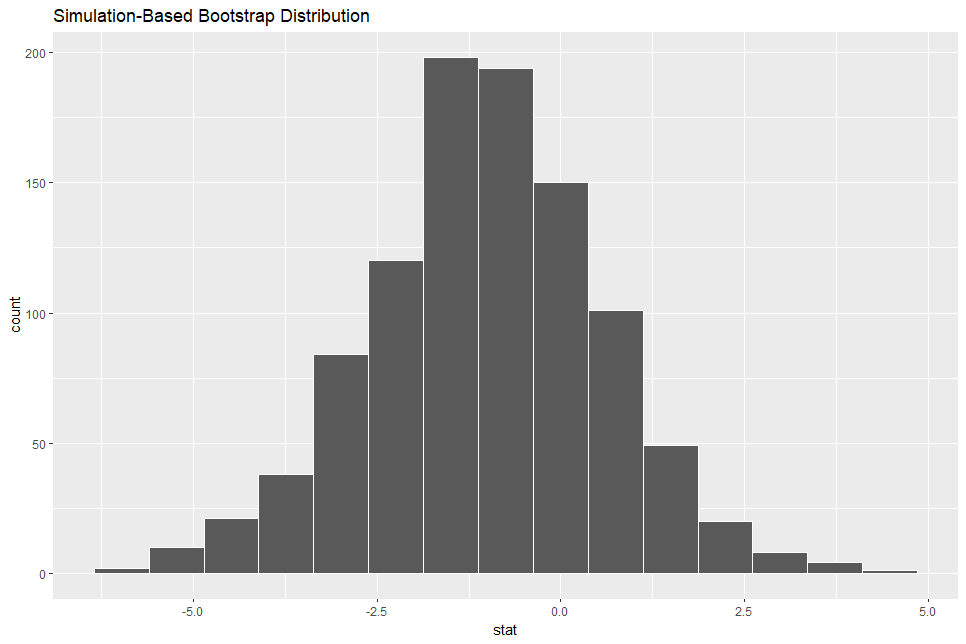
The bootstrap distribution looks symmetric.
Let's calculate 95% confidence interval using percentile method.
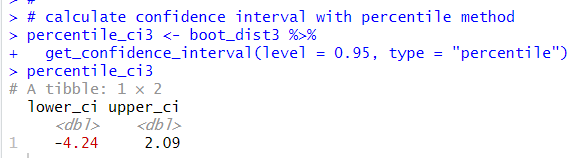
95% confidence intervals is from -4.24 to 2.09. It includes 0, so, I cannot reject the null hypothesis.
I also use standard error method to calclate confidence interval
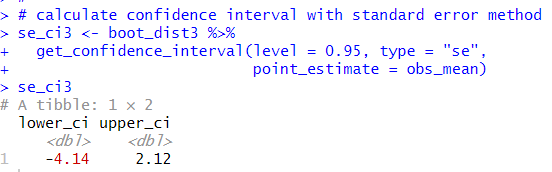
The the standard error method confidence interval is from -4.14 to 2.12. It included 0 too.
And I use t.test() function to get theory based confidence interval.
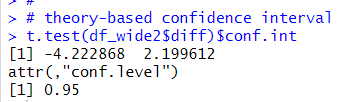
The theory based confidence interval also includes 0.
Then, let's visualize confidence interval.

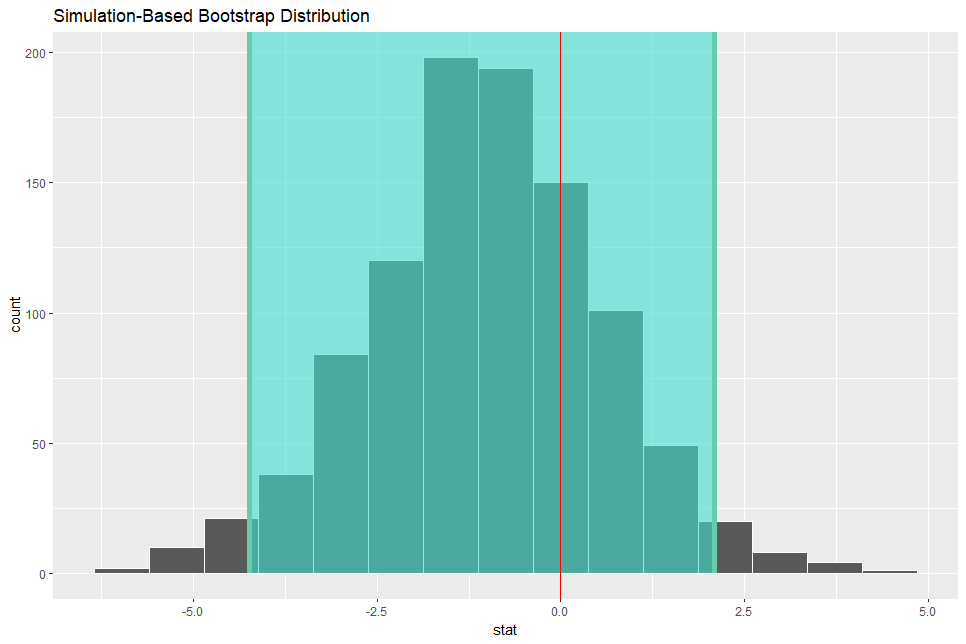
I added red vertical line with geom_vline() function at x = 0.
So, I cannot reject the null hypothesis:the meand "diff" = 0.
So my cloncution is there is not statistically significant difference between 2014 and 2020.
That's it. Thank you!
Next post is
To read from the first posrt,