
UnsplashのIvan Jevticが撮影した写真
This post is followong of the above post.
In this post I will check the first question, 1 - MEN and WOMEN have different replacement rate?
I use 'infer' package workflow, it is not theory-based inference but simulation-based inference.
First, let's check each average rate.
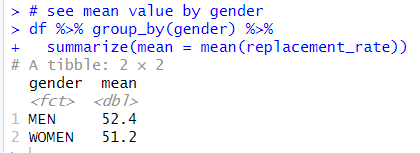
MEN average is 52.4 and WOMEN average is 51.2, thus MEN has higher replacement rate by 1.2.
I load infer package.
![]()
Let's calculate difference of means using infer package workflow.
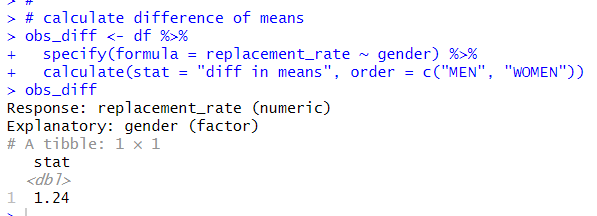
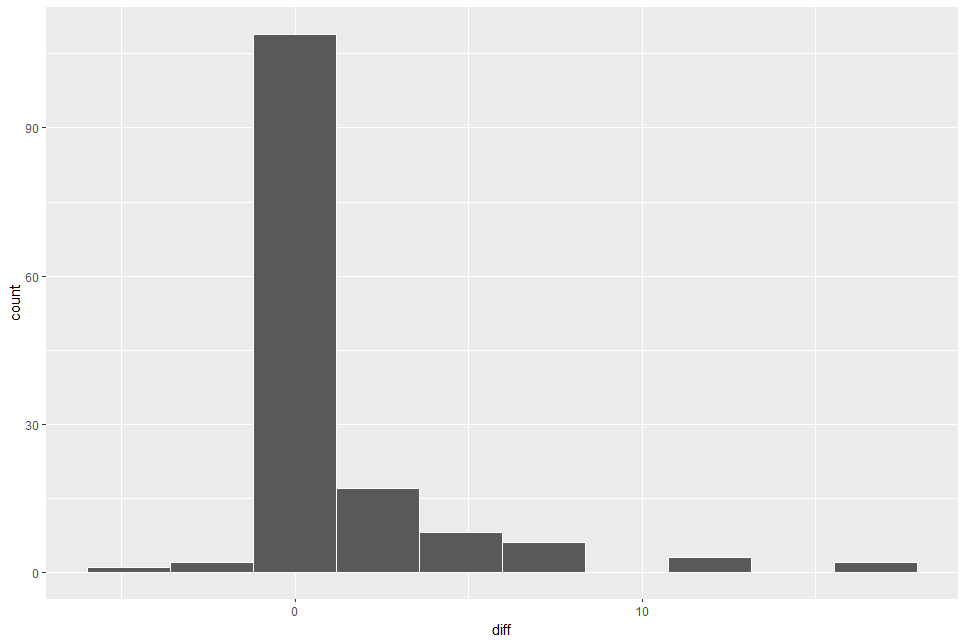
I use specify() function and calculate() function. The difference is 1.24.
Next, I make a null distribution.
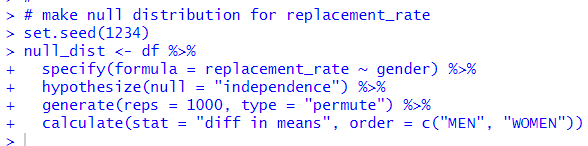
I use specify(), hypothesize(), generate() and calculate() function.
Let's visualize this null distribution using visualize() function.
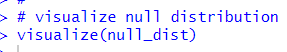
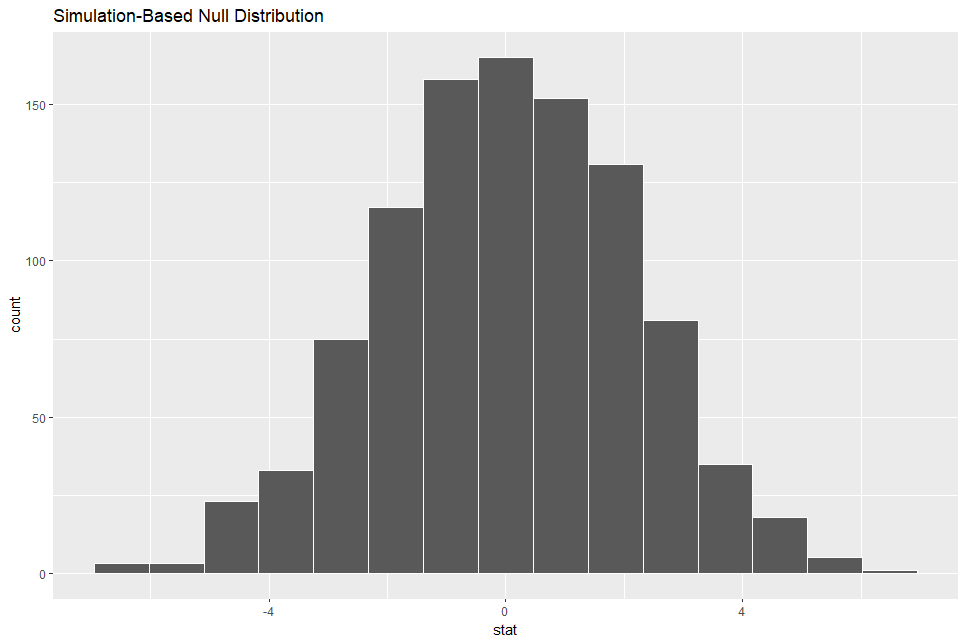
I see the distribution is around 0.
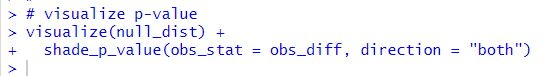
Then, let's visualize p-value.
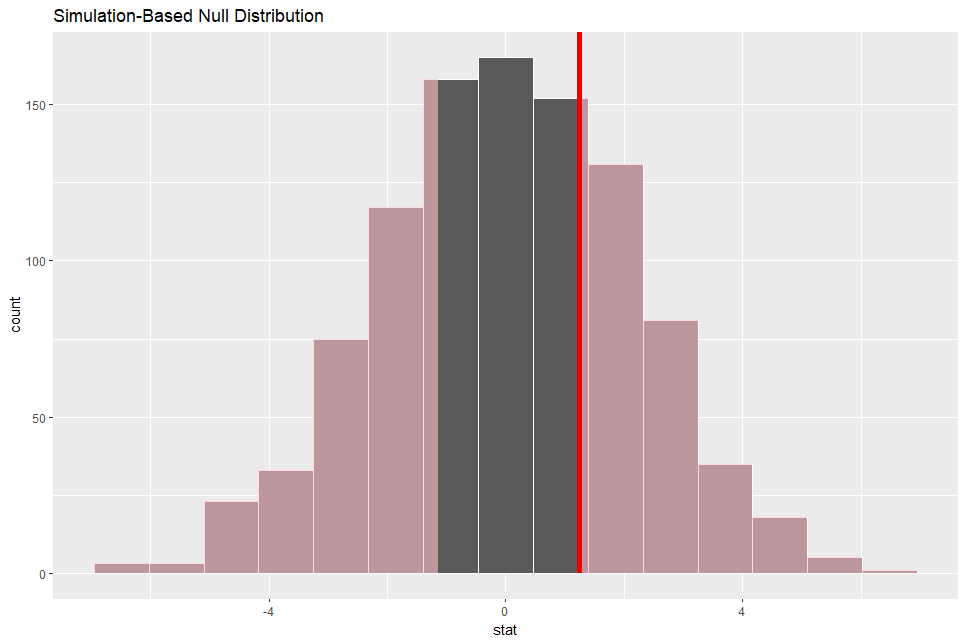
It looks 1.24 is common value.
What about the p-value?
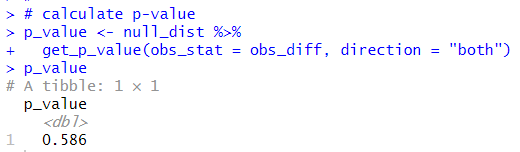
p-value is 0.586. So, I failed to reject reject null hypothesis: the difference is 0.
Next, let's create bootstrap distribution.
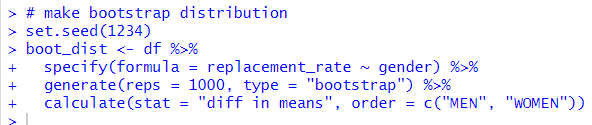
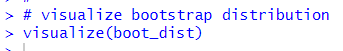
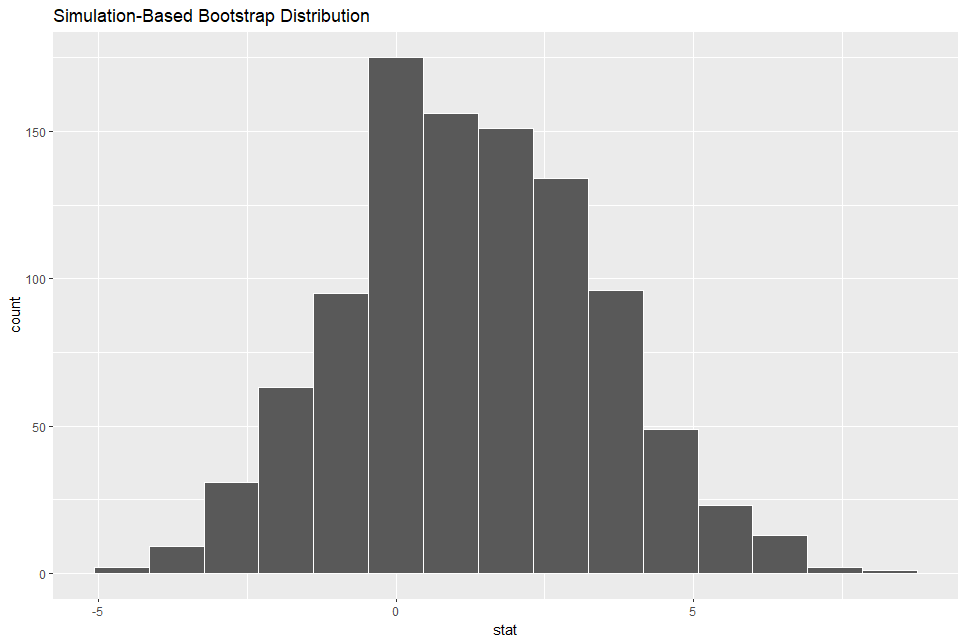
Then, let's visualize the bootstrap distribution.
Next, let's calculate confidence interval. There are two method available in infer package workflow, one is percentile method and the other is standard error method.
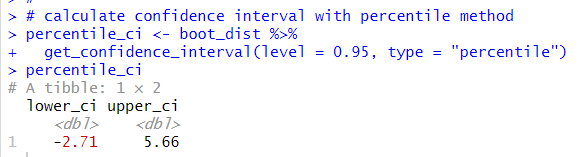
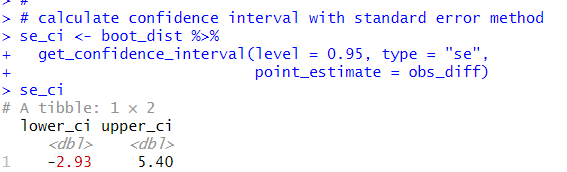
These two 95% confidence intervals are similar intervals.
Now, let's visualize confidence intervals.
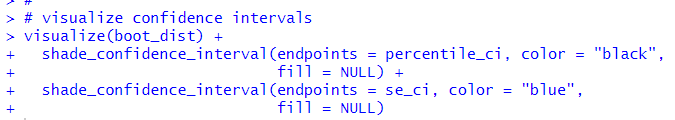
The both two confidence intervals include value:0, so it means there is not difference between MEN and WOMEN.
So, I can say there is not statistically significant difference between MEN and WOMEN.
No!, above inference does not consider each location characteristics.
So, I need to calclulate each locations difference between MEN and WOMEN.
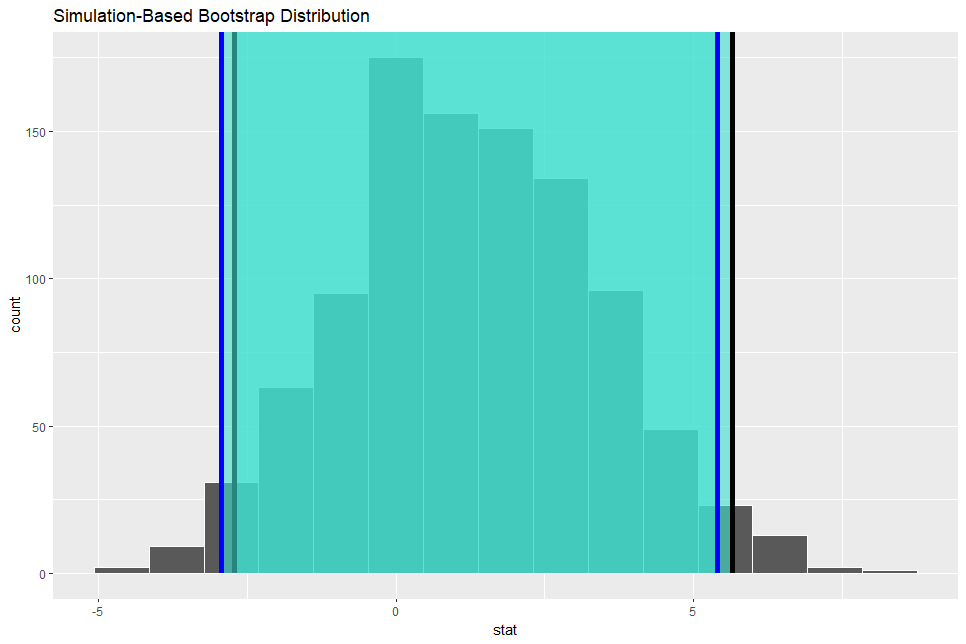
So, I will make a new data frame with pivot_wider() function.
In above data frame, my null hypothesis H0 is diff = 0. the alternative hypothesis is diff != 0.
Let's infer with infer package workflow.
First, let's visualize "diff" distribution.
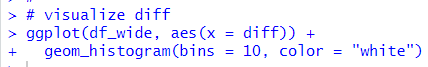
Almost observations are greater than 0.
Let's calculate observed mean of "diff".
It is ofcource the same as "obs_diff" which I calulated before.
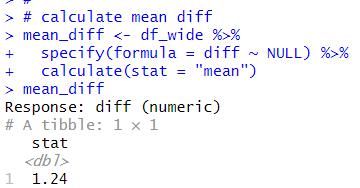
Then, let's make a null distribution.
Let's visualize the null distribution.
![]()
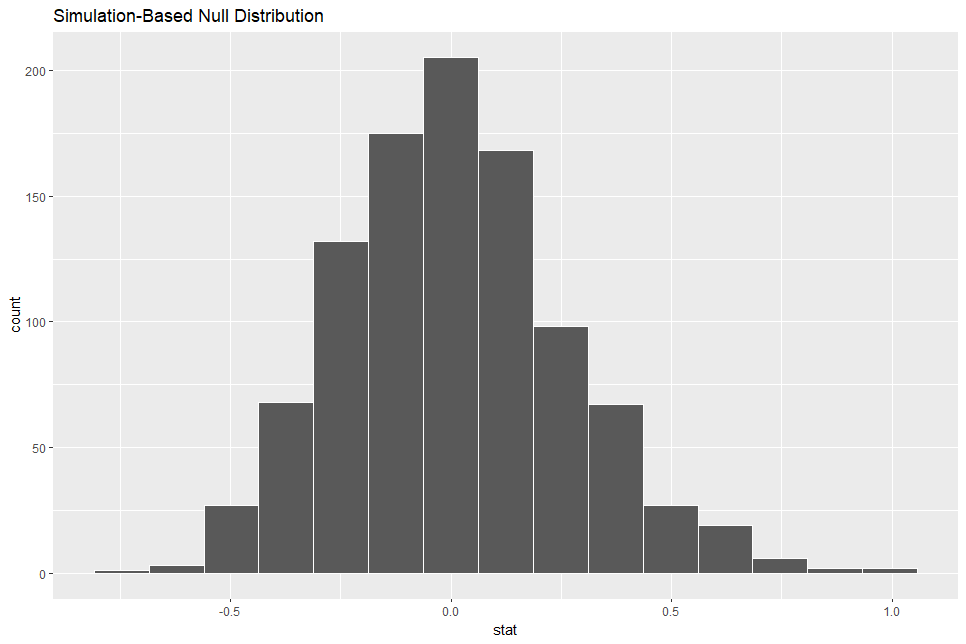
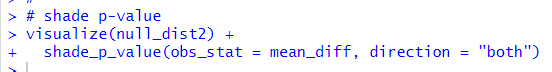
Then, let's visualize p-value.
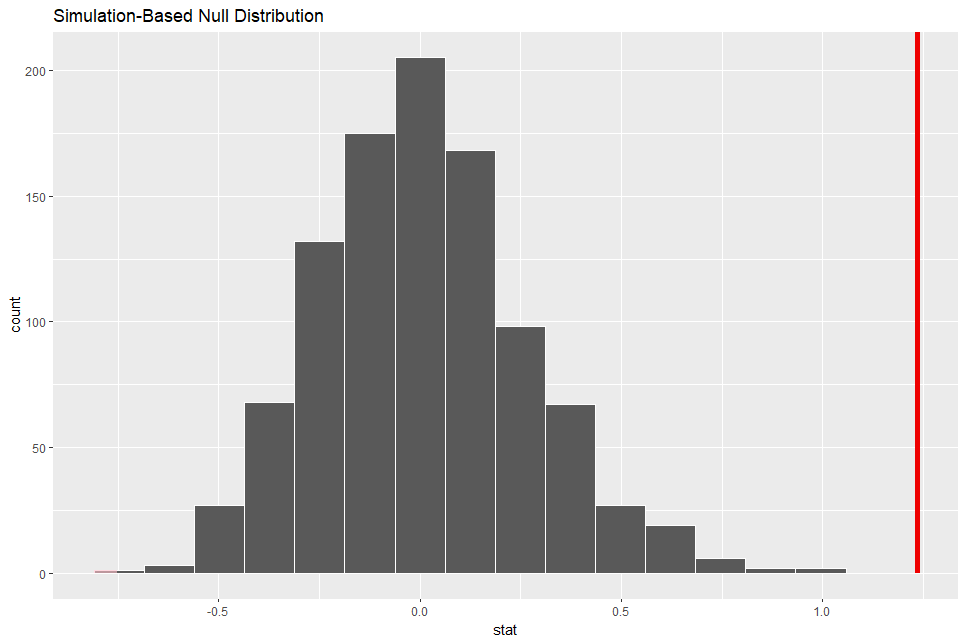
The red vertical line is at 1.24. So, 1.24 is very uncommon value.
Let's calculate p-value.
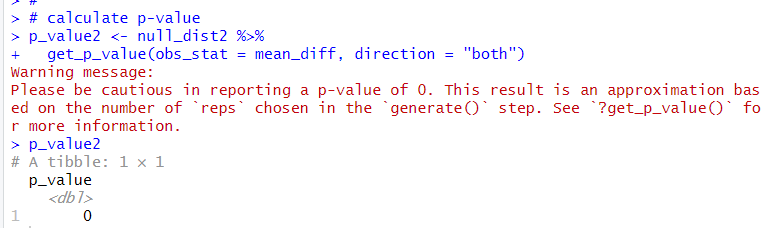
The p-value is 0, so I reject the hull hypothesis, H0: the difference = 0.
So, I can say there are difference between MEN and WOMEN about gross pension replacement rate.
Let's make a bootstrap distribution.
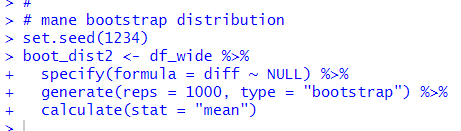
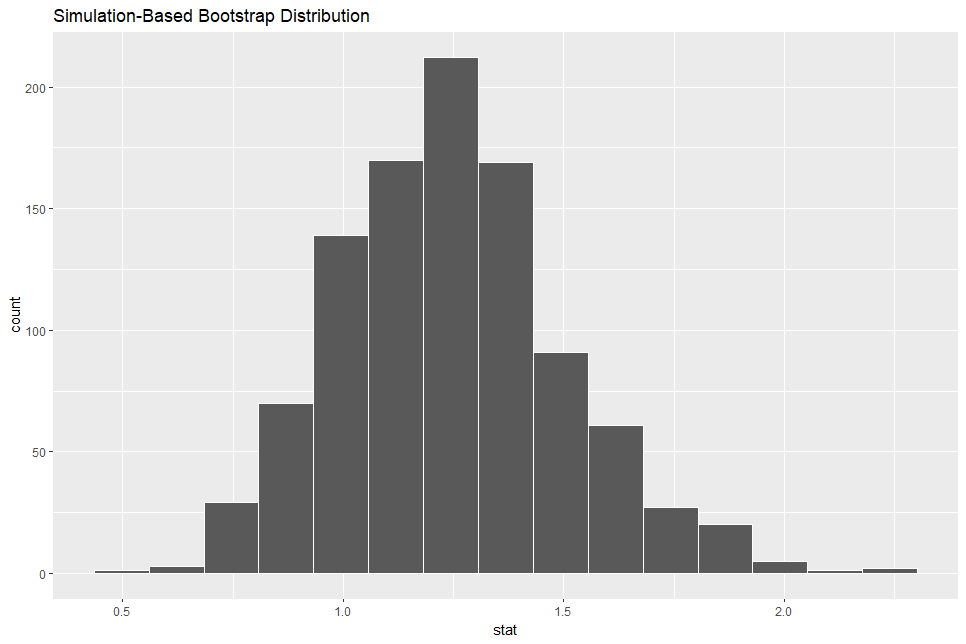
Let's visualise the bootstrap distribution.
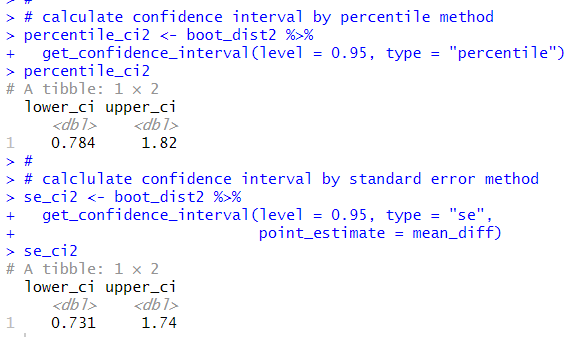
Next, let's calculate confidence interval.
Next, let's visualize these confidence intervals.
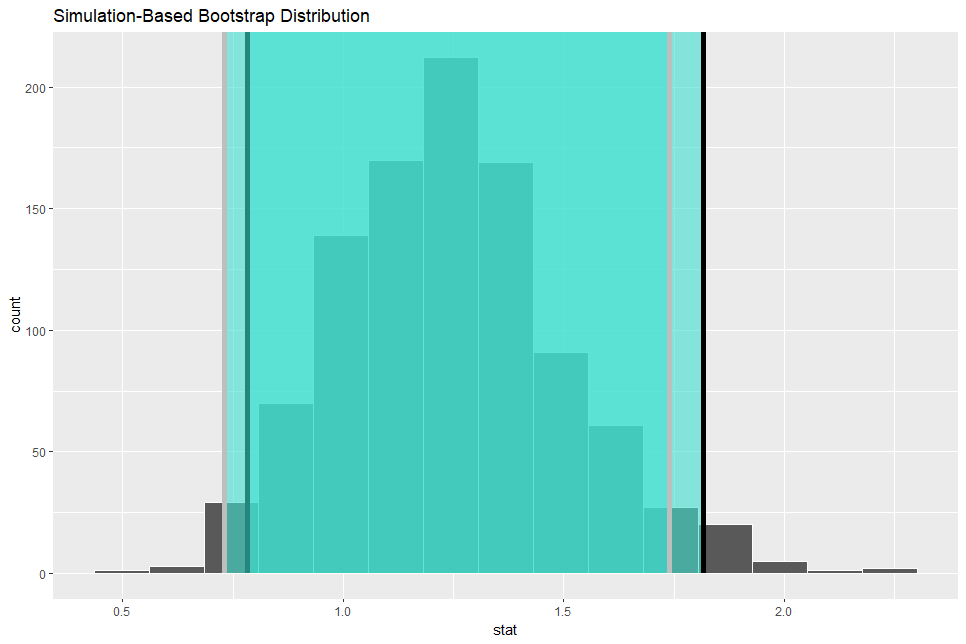
The both confidence intervals don't include 0. So I am 90% confident that the true difference between MEN and WOEMN is not equal.
I refere to infer - Tidy Statistical Inference • infer
That's it! Thank you!
Next post is
To read from the 1st post,