
Generated by Bing Image Creator : Photograph, Morning, Tall Waterfall, Wild Flowers from Birds View more green tone
This post is following of the above post.
In this post, I will do regression analysis. The dependent variable is vaccination rate, independent variable is lgdp, lpc, year and loc.
First, let's make simple regression model, independent variable is lgdp only.
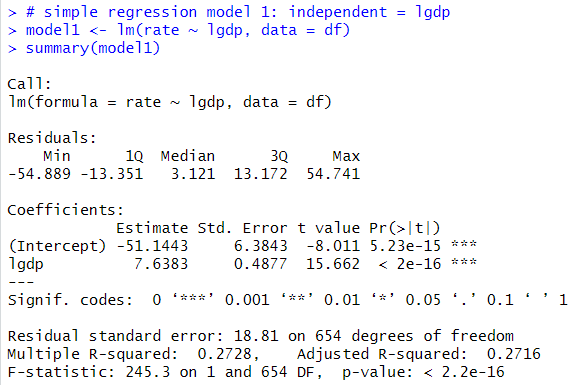
The Estimate of lgdp is 7.6383. If lgdp inclease by 1, rate will increase by 7.64. R2 is 0.2728.
Next model uses lpc as independent variable.
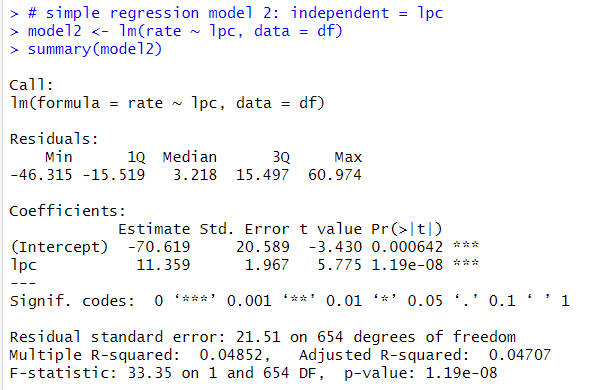
The estimate of lpc is 11.359. R2 is 0.04852. So, lgdp is better than lpc to explain vaccination rate.
Next model is using year as independent vatiable as numeric.
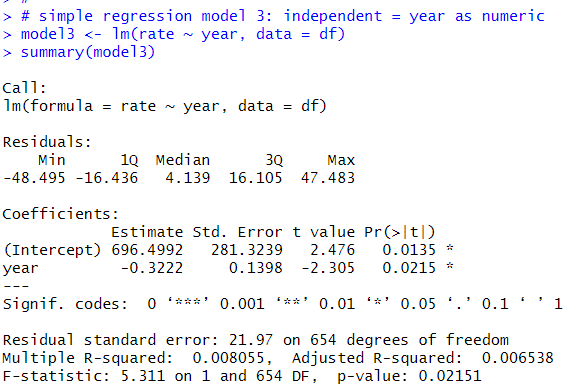
Estimate is -0.3222, R2 is 0.008055
Next model uses year as factor as independent variable.
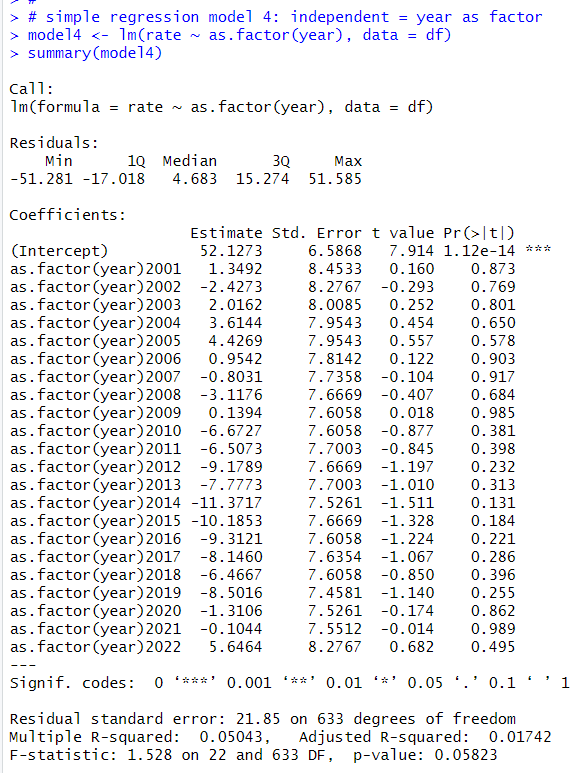
R2 is 0.05043, which is higher than model4, so, it it better to treat year as factor.
Next model is using loc as variable as factor.
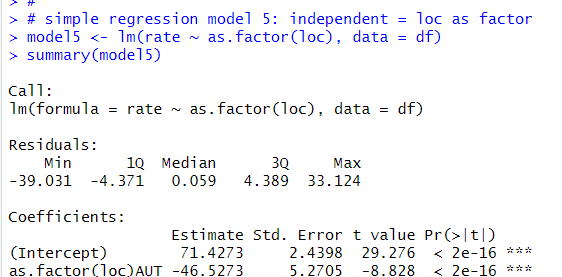
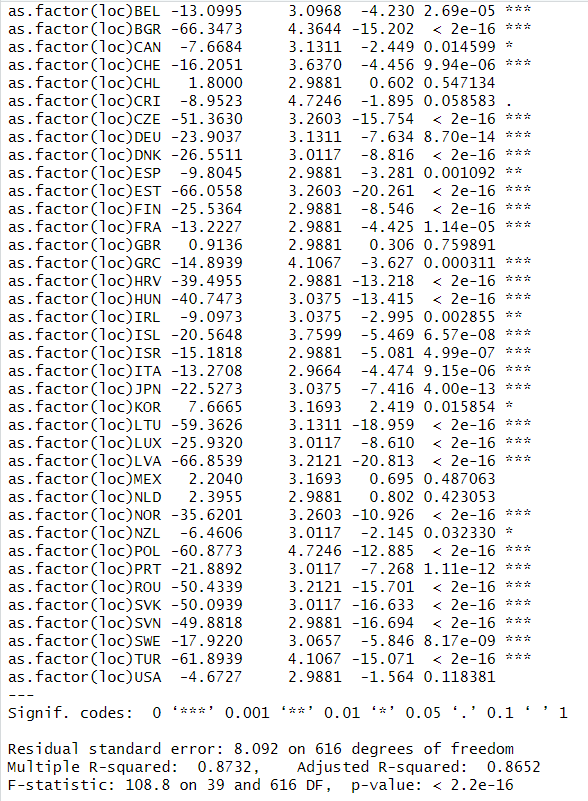
R2 is 0.8732.
Let's compare those models adjusted r squared.
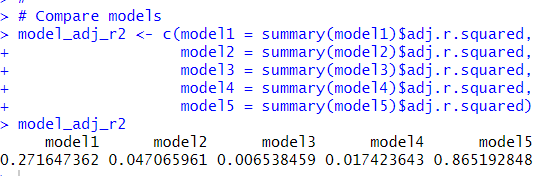
model5 has the largest adjusted R-squared. So, "loc" is the best dependent variable to explain vaccination rate.
That's it. Thank you!
Next post is
To read from the first post,