Generated by Bing Image Creator: Orion stars and beautiful forest
This post is following of the above post.
In the previous post, I did simple regression. In this post I will do multiple regressions.
We have 5 explnanatory variables, lgdp, lpc, year, as.factor(year) and as.factor(loc).
I will check two variables combinations among the five variables.
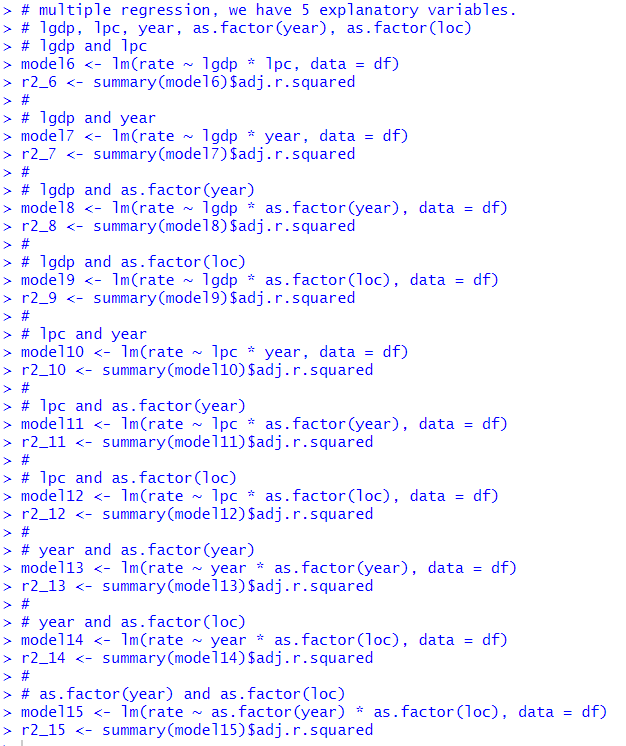
I made model6 to model15 and saved those model's adjusted R squared.
Let's comapre them.
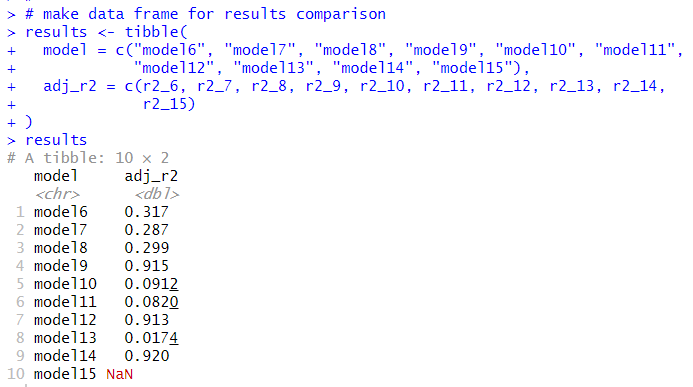
modl14 has the largest adjusted R suared. Let's see model14.
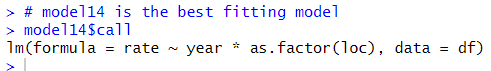
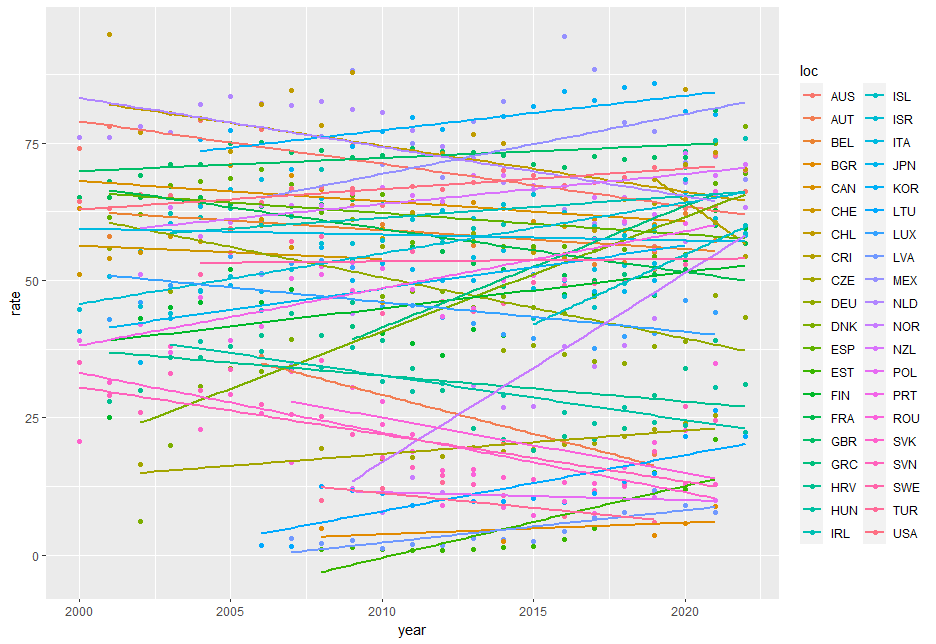
model14 explanatory variables are year and as.factor(loc).
Let's visualize the model.
That's it. Thank you!
to read from the first post,