
Generated by Bing Image Creator: long landscape view of green fields with blue sky and white clouds. There is phalaenopsis orchid flowers. Photo
This post is following of the above post.
In the previous post, I see three things,
1. Lead time to import varies by region.
2. Lead time to imprt varis by group.
3. Lead time to import does not vary by year.
In this post, I will check above hypothesis using infer package.
First, I load infer.

To chaeck above hypothesis, I will do ANOVA analysis.
I will use code from Tidy ANOVA (Analysis of Variance) with infer • infer
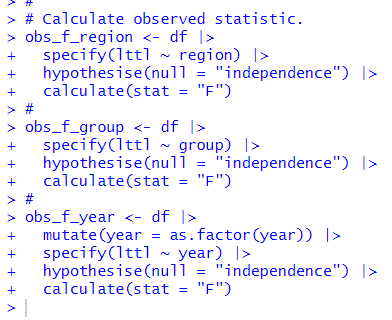
First, I calculate observed statistic.
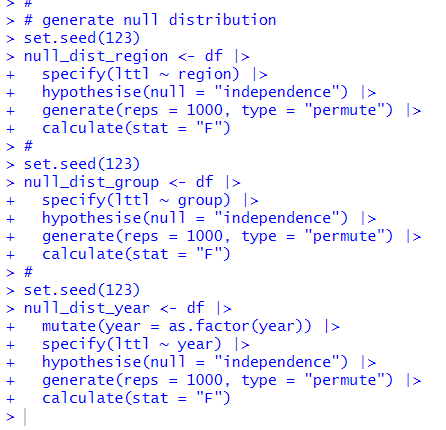
Next, I generate the null distribution using randomization.
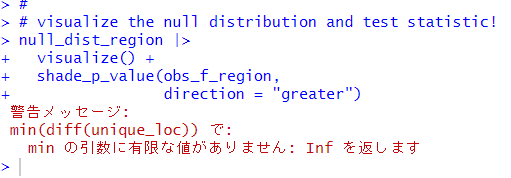
All right, let's visualize them!
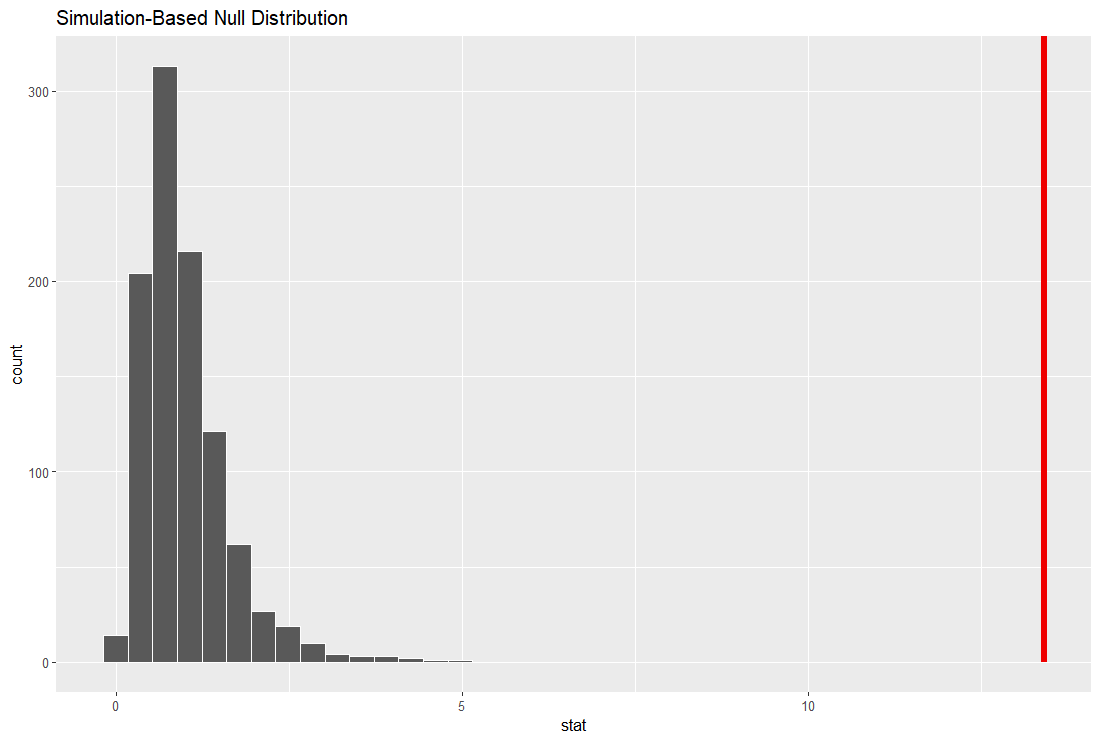
For region, obserbed F is far away from the null distribution.
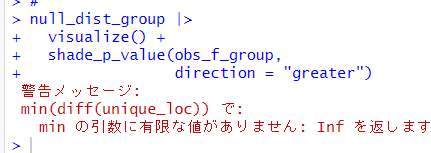
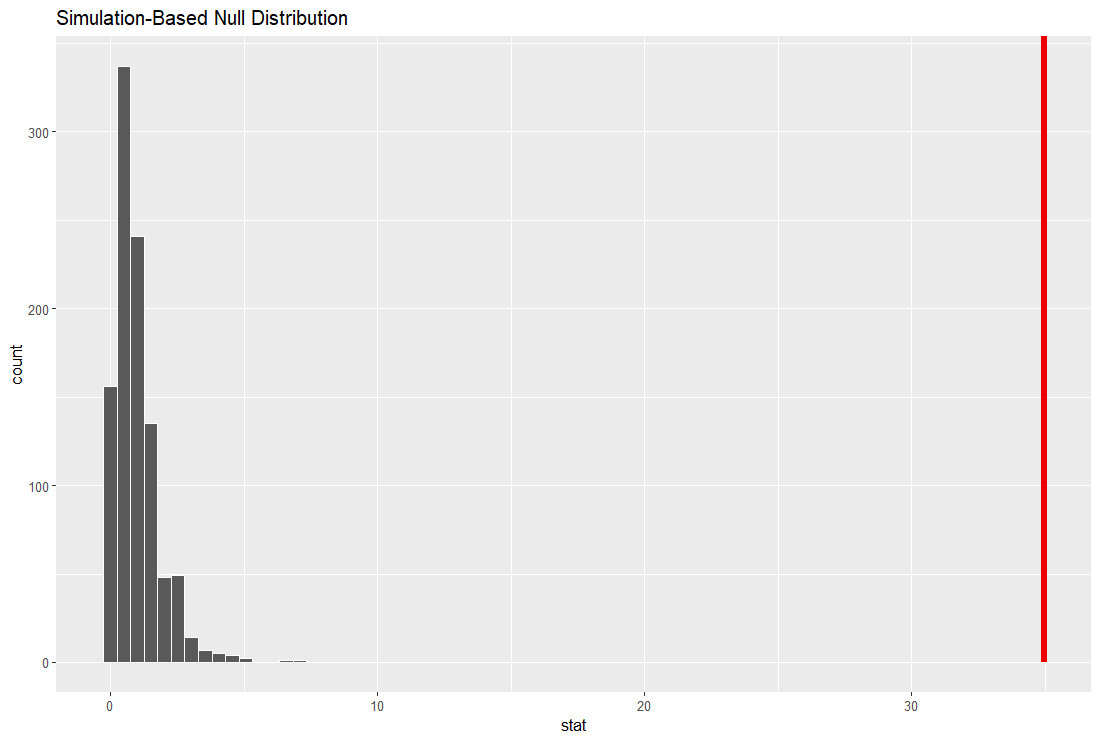
For group, obserbed F statistic is far away from the null distribution too!

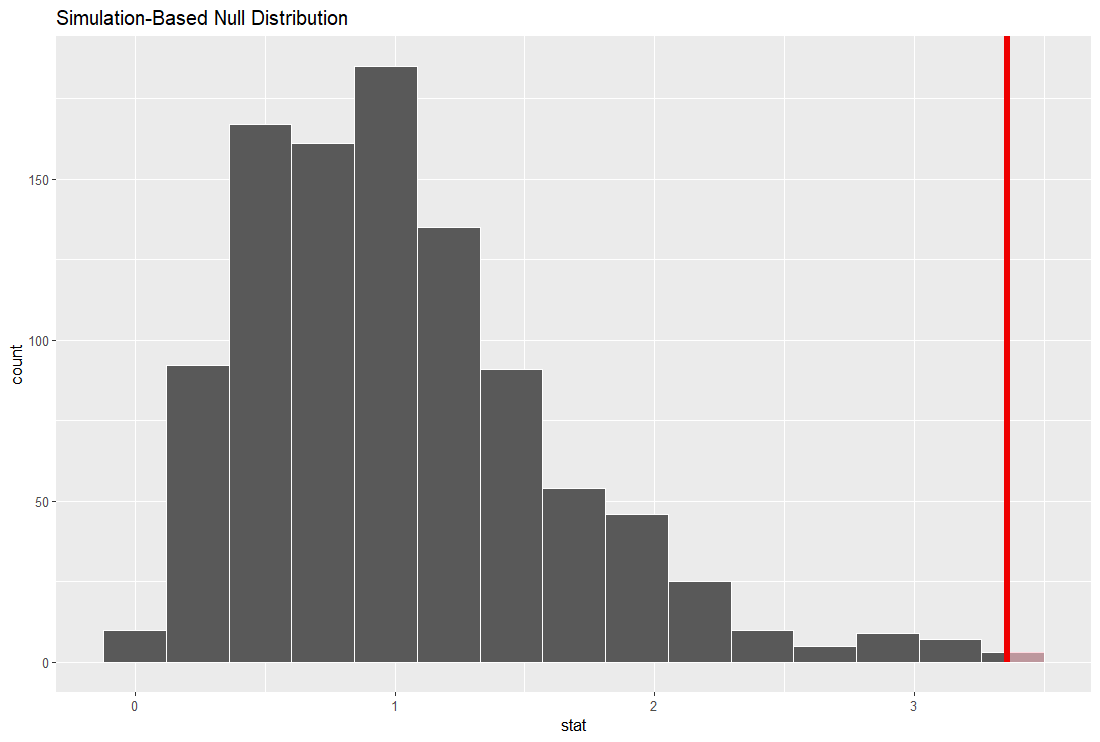
For year, the observed F stat is not far away from the null distribution.
Last, let's calculate p-values.
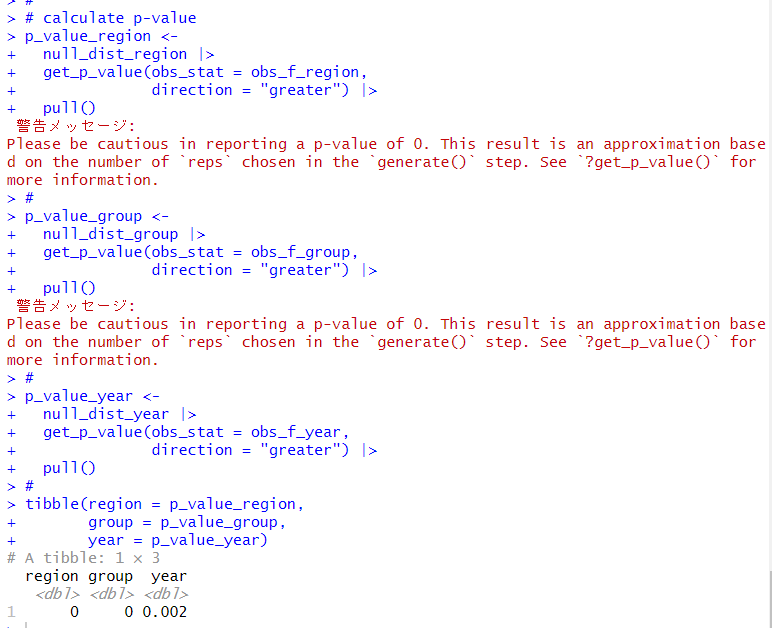
All three p-values are smaller than 0.01.
So I amd 99% confidence that Lead time to import varis by region, group and year.
That's it. Thank you!
Next post is
To read from the first post,