
This post is following of above post.
In this post, let's see ODAGRANT & PCT_GNI.
What is the highest ODAGRAN & PCT_GNI country - year?
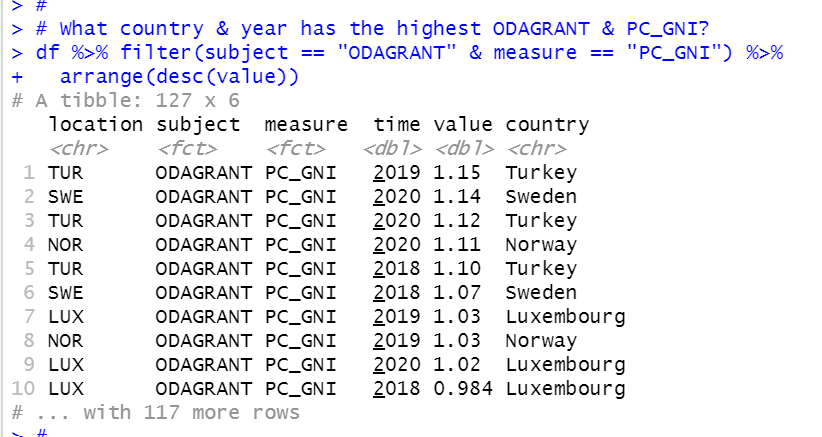
2019 Turkey has the highest ODAGRANT & PC_GNI.
What is the highest average ODAGRANT PC_GNI?
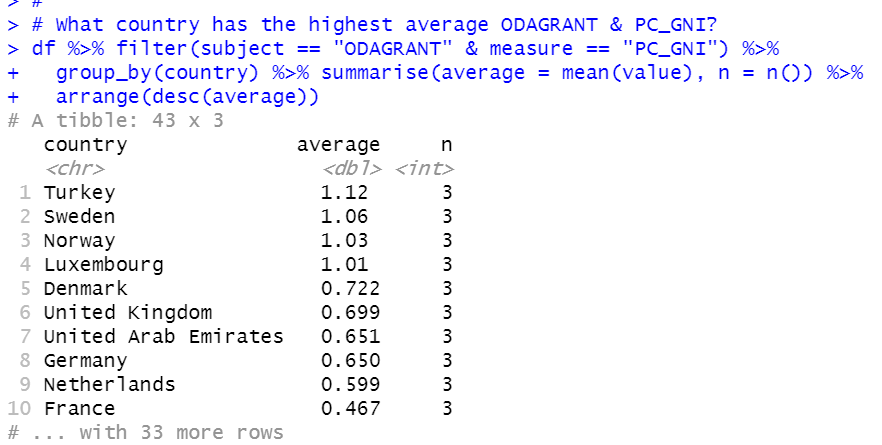
By average, Turkey has the highest ODAGRANT PCT_GNI.
Let's see time trend for ODAGRANT & PCT_GNI.
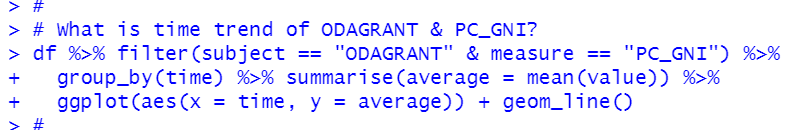
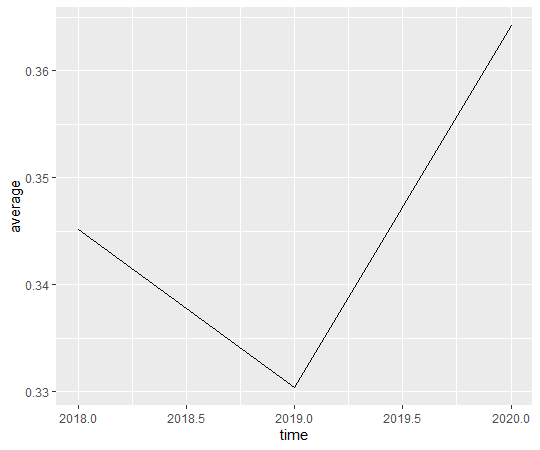
We have 2018, 2019 and 2020 data. 2020 has the highest ODAGRANT & PCT_GNI.
Let's make histogram for ODAGRANT & PCT_GNI.

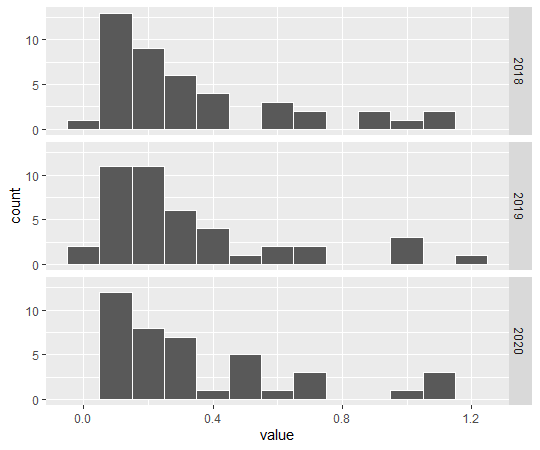
This histogram shows there is not significant difference by year.
Let's test it with aov() function.

Pr(>F) shows 0.872. So, it shows there are not significant difference between time.
That's it. Thank you!
To see the 1st post,