www.crosshyou.info

政府統計の総合窓口のデータや、OECDやUCIやのデータを使って、Rの練習をしています。ときどき、読書記録も載せています。

OECD Net Oda data analysis 8 - PCA(Principal Component Analysis) shows G7 countries

f:id:cross_hyou:20210706204310j:plain

Photo by Navi Photography on Unsplash


www.crosshyou.info


This post is following of above post.

In this post, I use PCA(Principal Component Analysis).
First, I make a data frame for PCA.

f:id:cross_hyou:20210706204647p:plain

Then, I use prcomp() function to do PCA.

f:id:cross_hyou:20210706204756p:plain

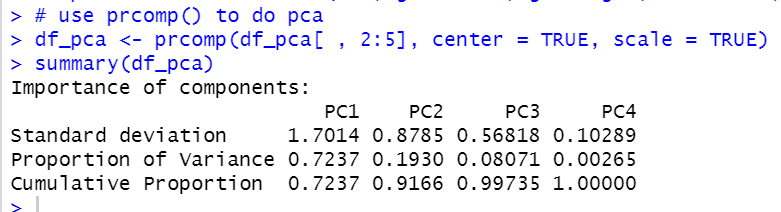
We see PC1 explaines 72.4% of data set variance, PC1 and PC2 explaines 91.7% of data set variance.

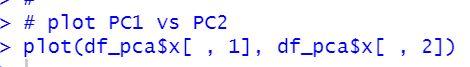
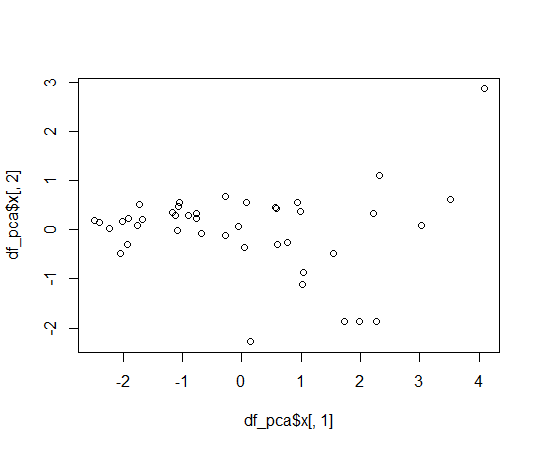
Let's plot PC1 and PC2.

f:id:cross_hyou:20210706205037p:plain

f:id:cross_hyou:20210706205050p:plain

Okay, let's plot iso code on the plot.

f:id:cross_hyou:20210706205311p:plain

f:id:cross_hyou:20210706205321p:plain

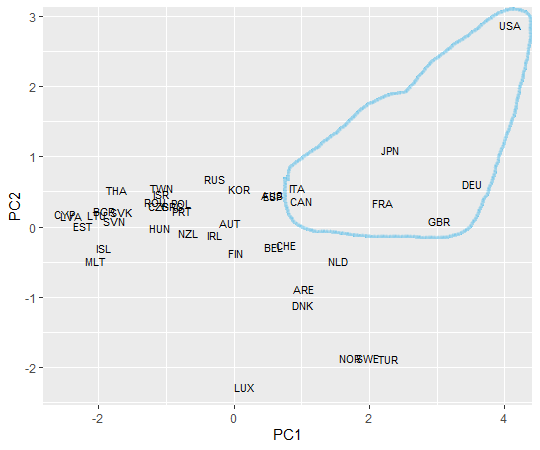
We see G7 countries are plotted at upper right hand area.
That' it! Thank you!

For the 1st post,


www.crosshyou.info