
Photo by Ash from Modern Afflatus on Unsplash
This post is following of above post.
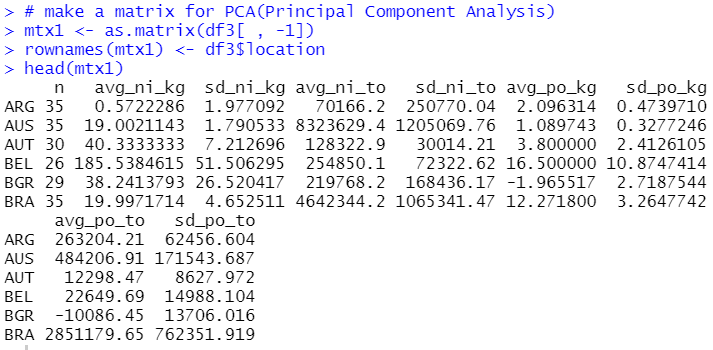
In the above post, I made a dataframe which has basic statistics data for each locations.
Let's look into it further,
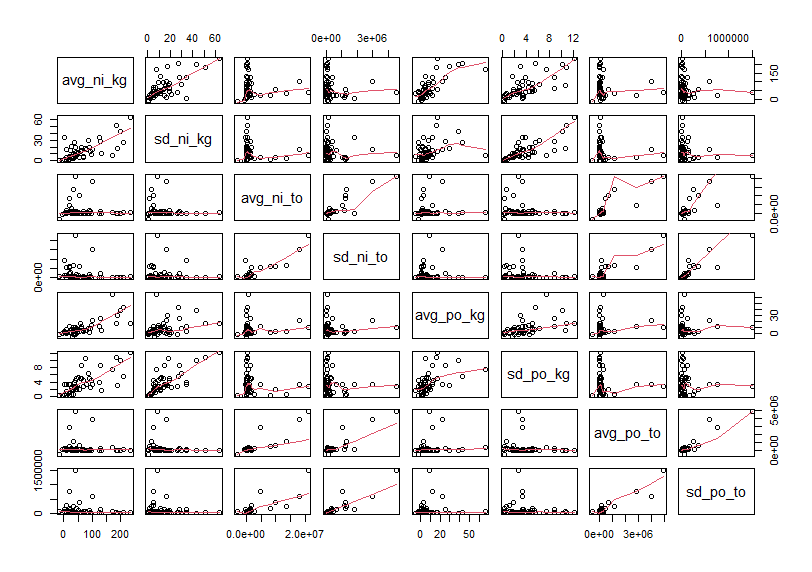
Firstly, let's see scatter plot matrix.
Let's make correlation matrix.
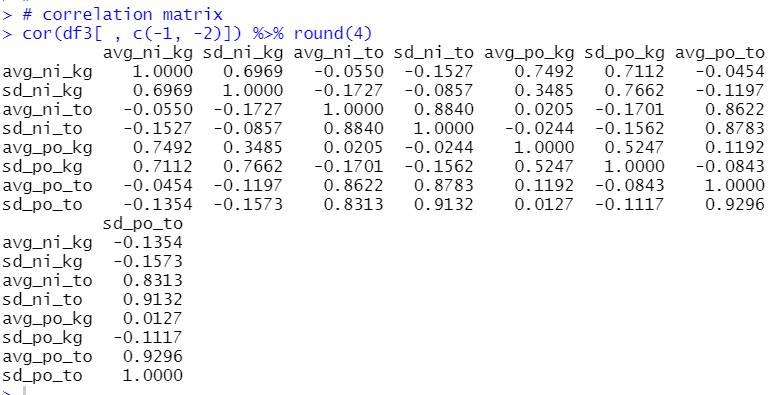
Some pairs are having high correlation, for example avg_po_to and sd_po_to are 0.9296.
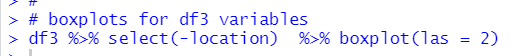
Let's see boxplots.
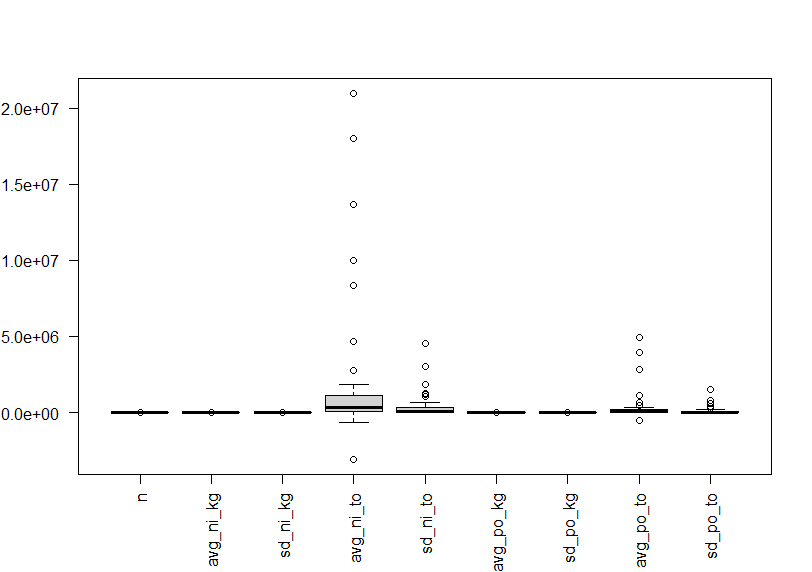
Since these variables have different value levels, above boxplot is not useful.
Let's convert variables to standardized with scale() function.

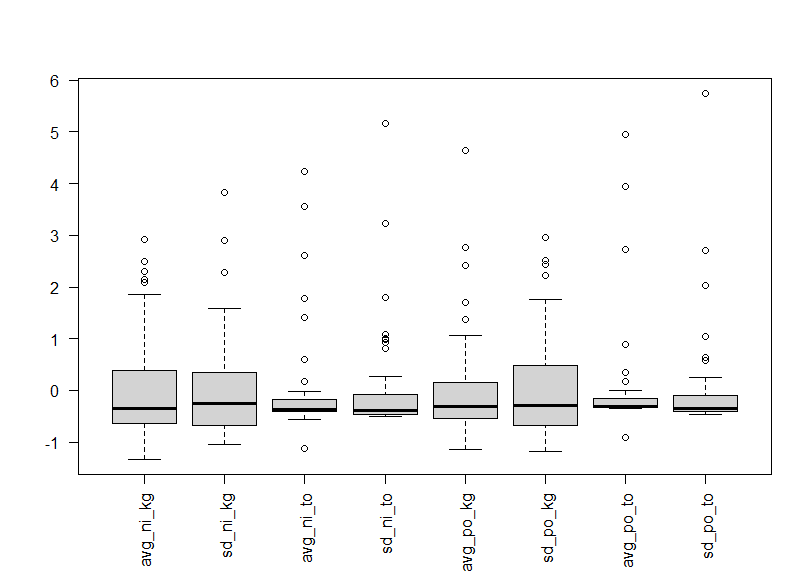
We see almost variables have outliers in the upper side.
So far, df3 has many variables and it makes a bit difficult for me to analysis. So, let's do PCA(Principal Component Analysis).
Firstly, let's make a matrix for PCA.
I can use prcomp() function.

pca$rotation is the eigenvectors which is by default in the negative direction.
So, we have to multiply -1 to see correct value.
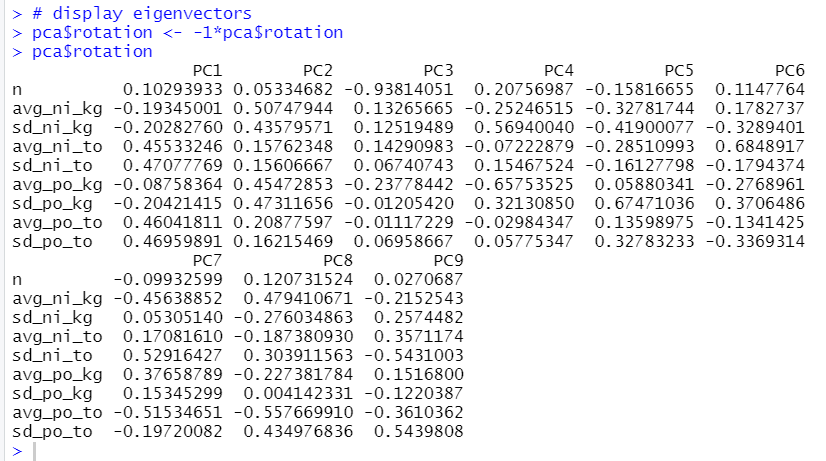
For PC1, avg_ni_to, sd_ni_to, avg_po_to and sd_po_to have relatively high value.
For PC2, all variables have positive value.
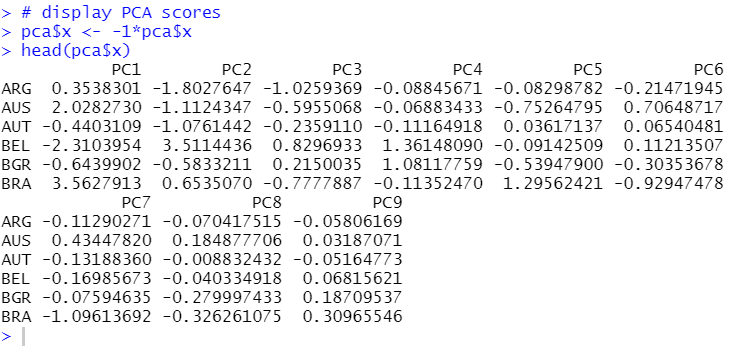
pca$x is the PCA scores, which also have negative sigine by default.
Let's see it.
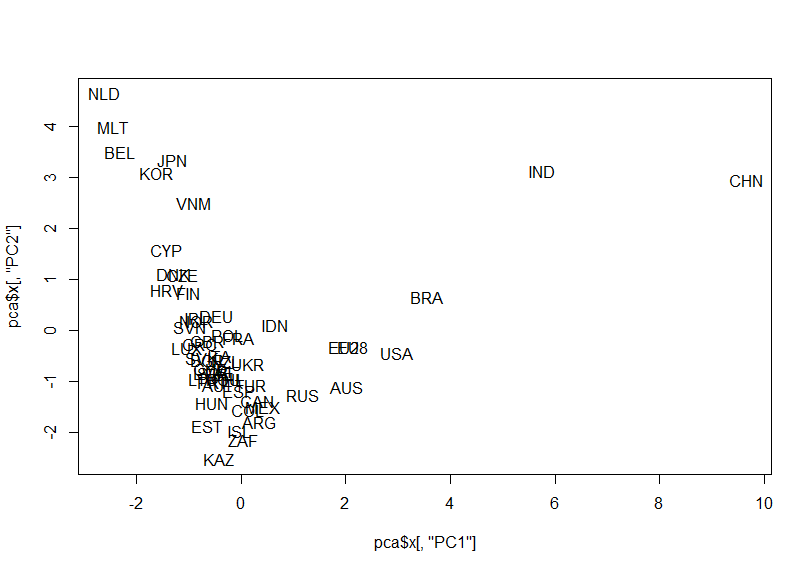
Let's make a scatter plot for PC1 vs. PC2

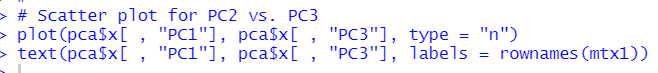
Let's make a scatter plot for PC1 vs. PC3
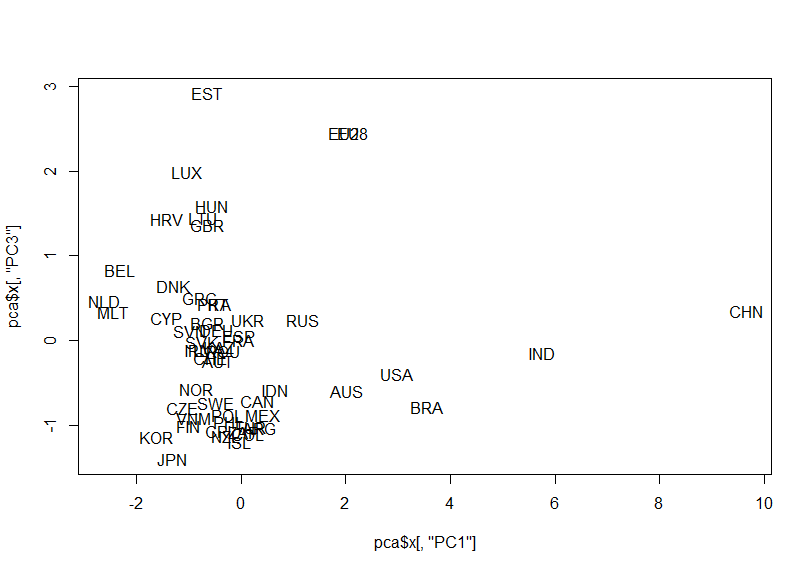
How about PC2 vs. PC3?

Oh, I forgot to see summary of pca object.
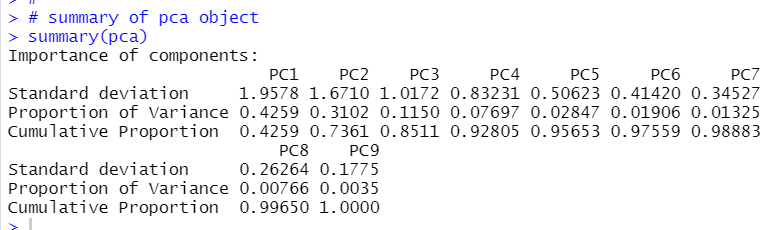
We will see PC1 represents 42.59%, PC1 + PC2 represents 73.61%.
biplot() function displays pca results.

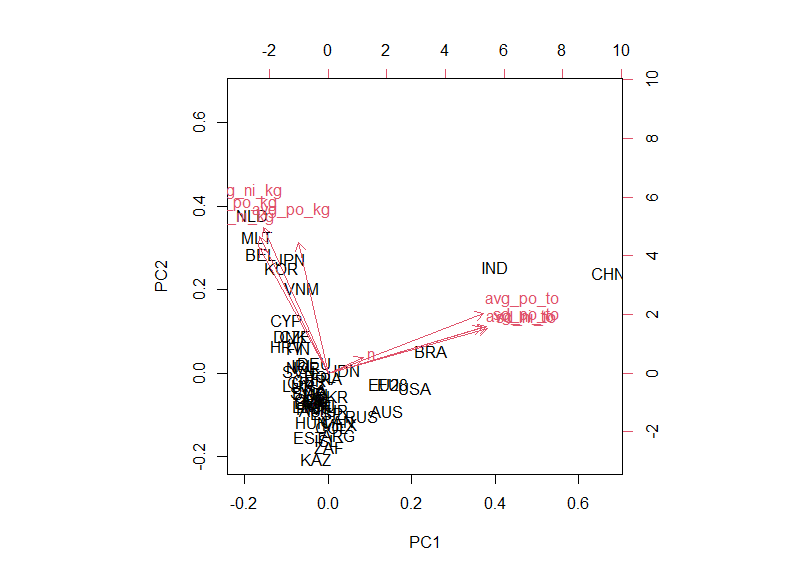
I can see CHN and IND are relatively different from other locations.
That's it. Thank you!
The next post is
To read from the 1st post,