
Photo by henry perks on Unsplash
This post is following of above post.
I load Unenployment rate data. I get this data from OECD we site.
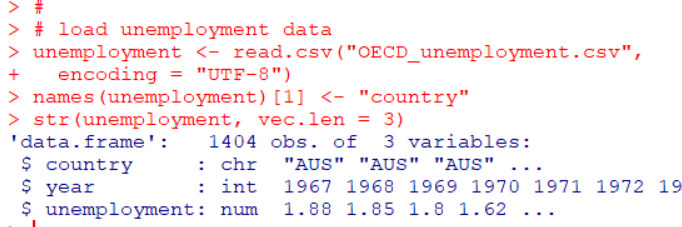
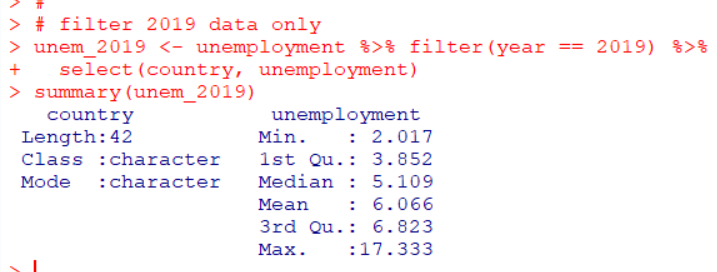
Then, I filter only year == 2019.
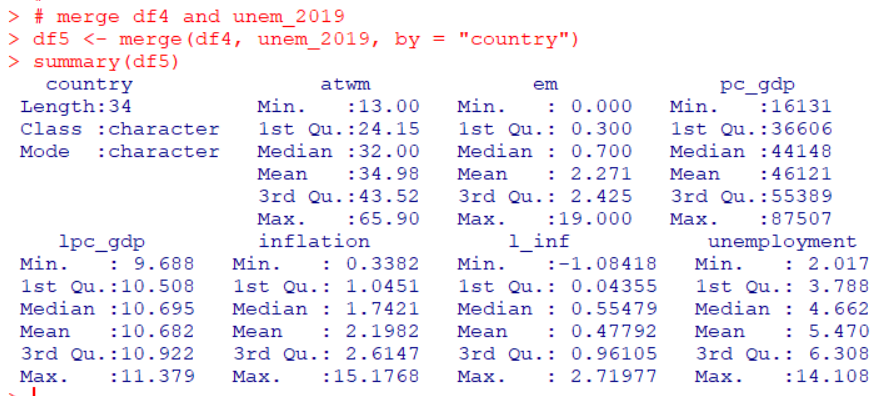
Next, I will merge df4 data frame and unem_2019 data frame with merge() function.
let's see how unemployment data is distributed.
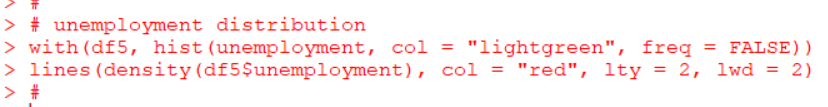
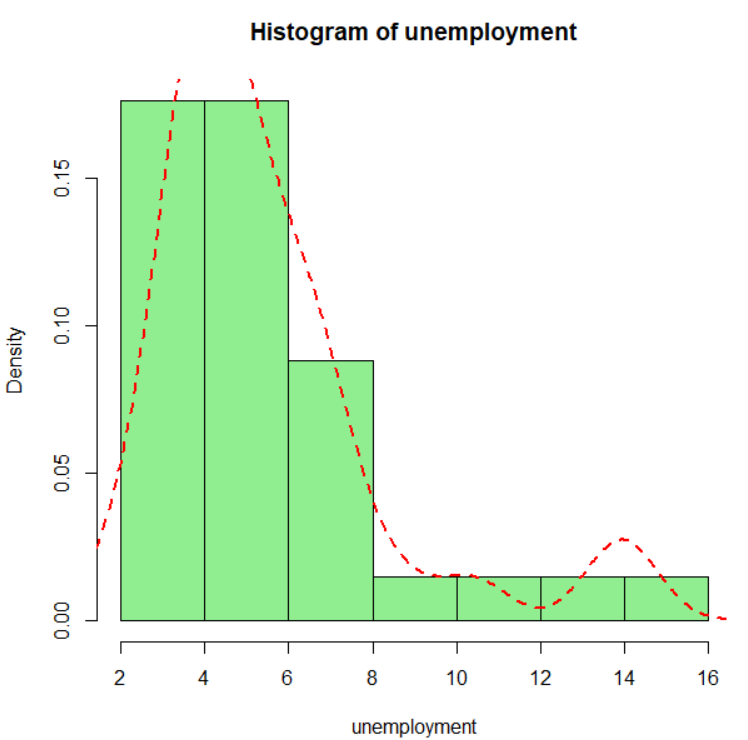
it seems skewed.
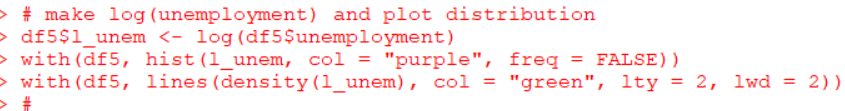
Let's make log(unenployment) histogram.
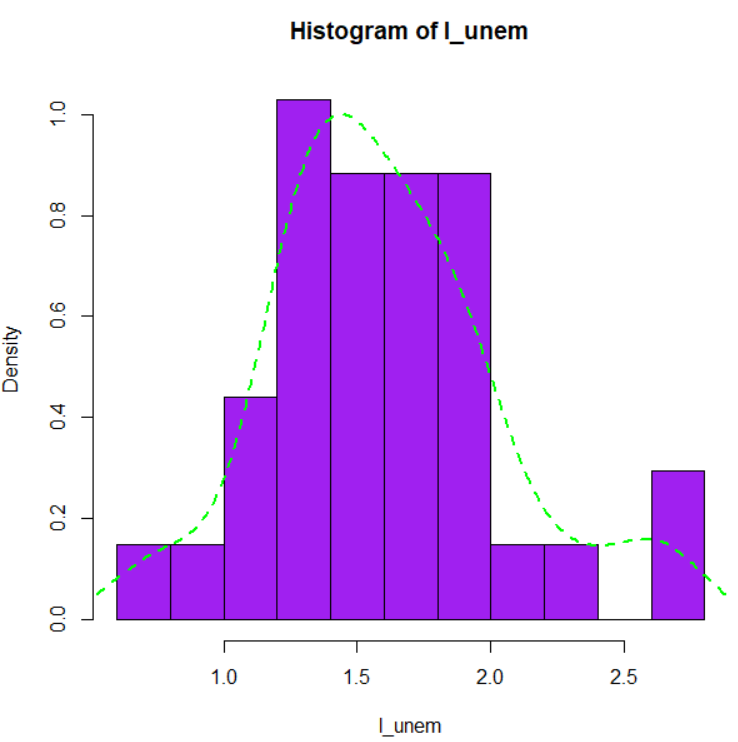
l_unem, log(unemployment) is more close to normal distribution, so I will use l_unem for linear regression analysis.
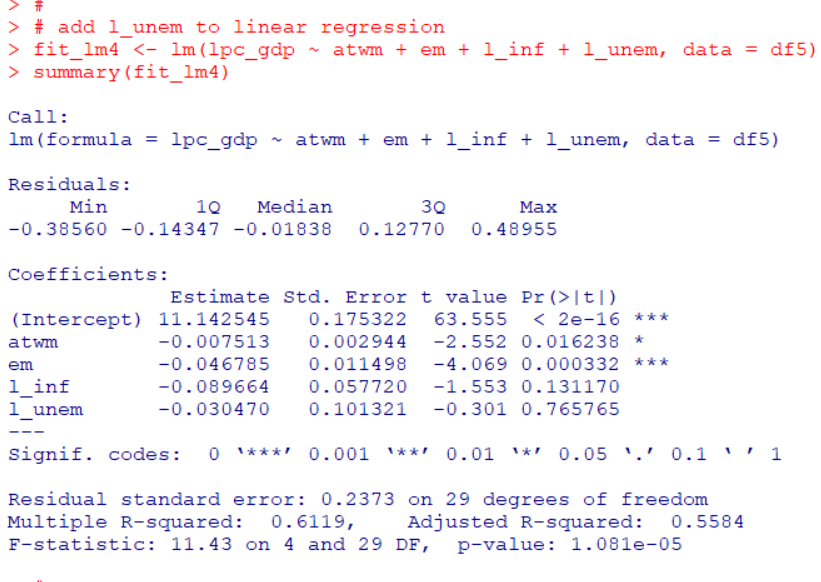
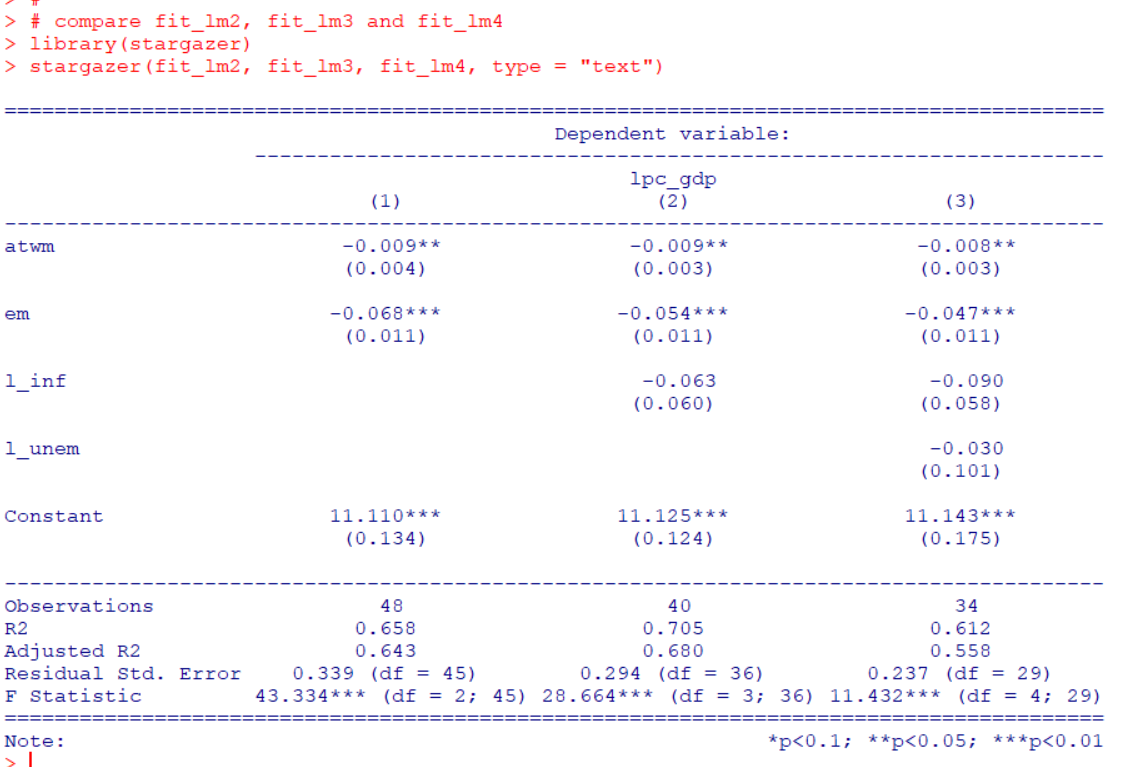
After adding log(unemployment), "atwm": Attitides Towards Working Mothers and "em": Early Marriage are still significant varaibales.
Let's compare three liear regression model results.
That's it. Thank you!
Next post is
To read the 1st post,