Generated by Bing Image Creator: Large tree, tiny flowers, green grass, blue sky and white clouds, morning, photo
This post is follwoing of the previous post.
In this post, I will do regression analysis, with traditional(theoretical based) way and modern(simulation based) way.
Before doing analysis, I load "infer" package.

Let's start with traditional(theoretical based) linear regression analysis.
I use lm() function.

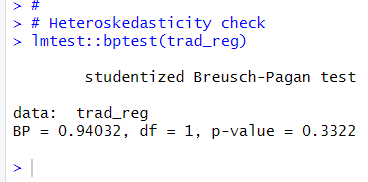
In traditional way, we need to check heteroskedasticiy. I use bptest() function on lmtest package.

p-value is greater than 0.05, so there is not heteroskedasticity.
Let's get confidence interval.

95% confidence intarval is -0.322 to -0.119, which does not include 0, so, Y2006 is negative relationship to Chg_Net.
Let's make a plot.


Next, I will do modern(simulation based) regression analysis.
First, I get observed intercept and slope.

Intercept is 1.91, slope is -0.221, which are the same as traditional way.
Since simulation based analysis does not require to check heteroskedasticity, I don't do it.
Next, I make bootstrap simulation.

Then, I calculate confidence interval.

95% Confidence Interval for Y2006 is -0.303 to -0.140, they are slightly different from traditional confidence interval.
Let's visualize the both confidence intervals with boot strap distribution.


Red vertical lines are traditional(theoretical based) confidence interval, green lines are modern(simulation based) confidence interval.
We see modern(simulation based) confidence interval is narrower than tradional(teoretical based) confidence interval.
That's it. Thank you!
Next post is
To read from the first post,