
UnsplashのHan Chenxuが撮影した写真
This post is floowing of the above post.
In the above post, I find year 2020 and 2021 have COVID-19 effect and each locations has their own characteristics.
So I will focus a few locations without 2020 and 2021.
Since I live in Japan, let's focus on JPN.
I made a data frame which contains JPN only and without 2020 and 2021.
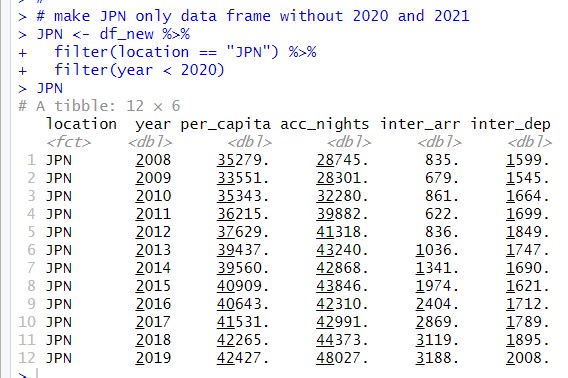
Let's see per_capita, acc_nights, inter_arr and inter_dep line grpah with geom_line() function.

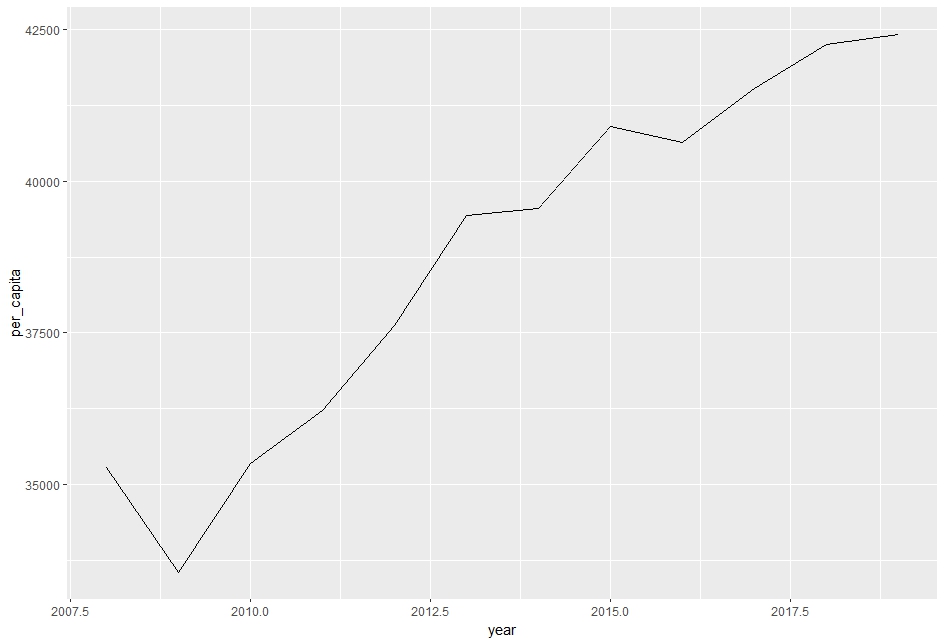
per_capita has up trend.

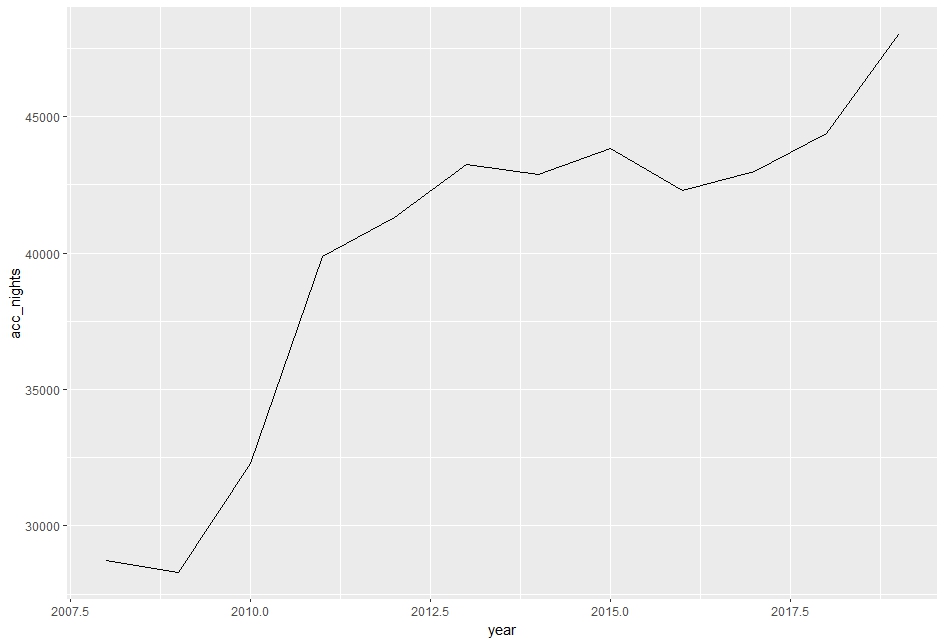
acc_nights has up trend too.

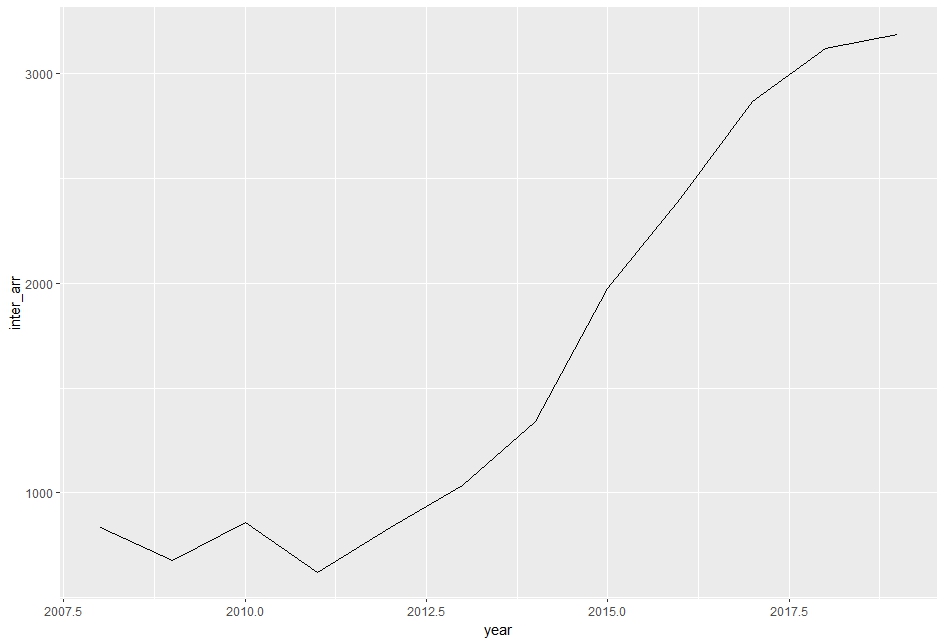
inter_arr has up trend too.

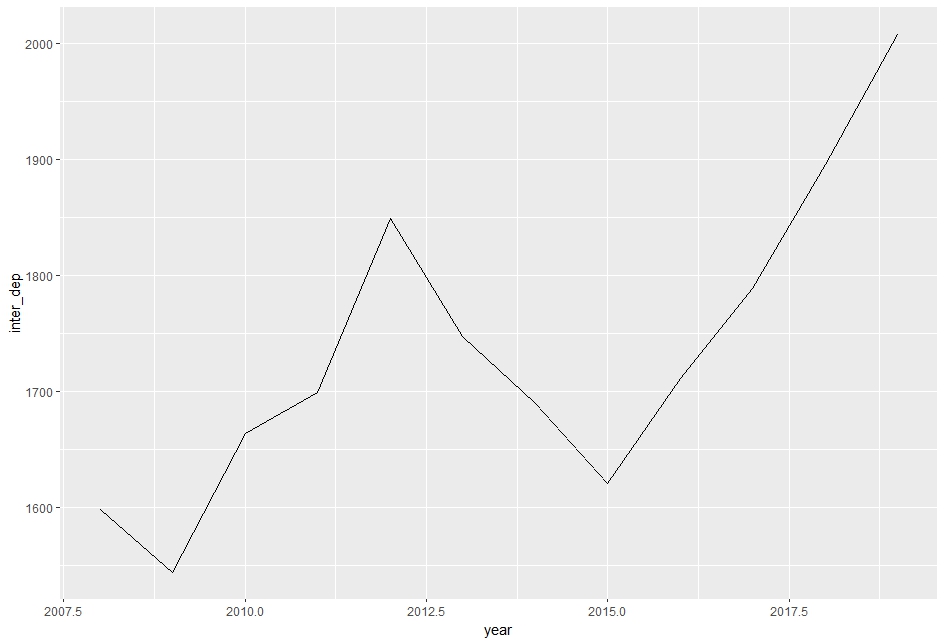
inter_dep has up trend but it has double bottom in 2009 and 2025.
So, all four variables have clear up trend. Then, I will add time trend variable.
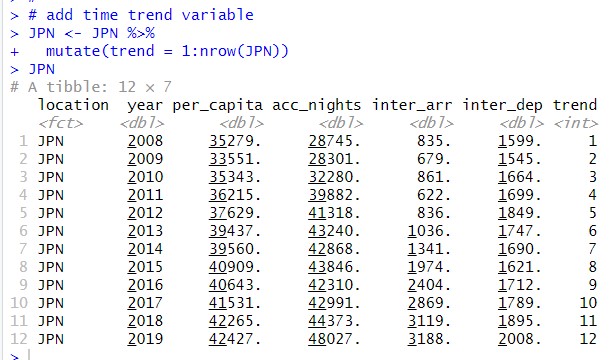
I will do regression analysis for acc_nights, inter_arr and inter_dep on per_capita and trend.
First, let's do acc_nights.
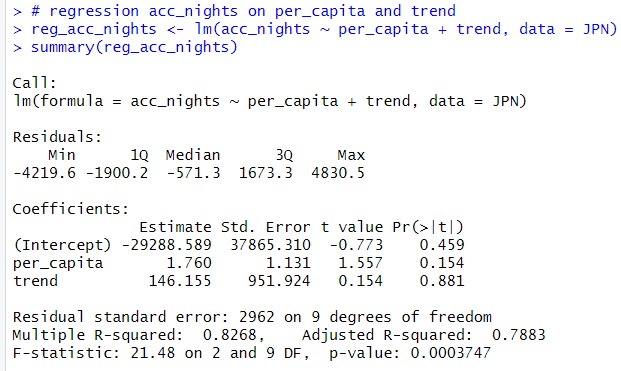
p-value is less than 0.05 and this model seems valid. coefficient of per_capita is 1.760.
So, when per_capita increase by 1, acc_nights will increase 1.760. but p-value is 0.154 so, I cannot say per_capita is statistically significant.
How about inter_arr?
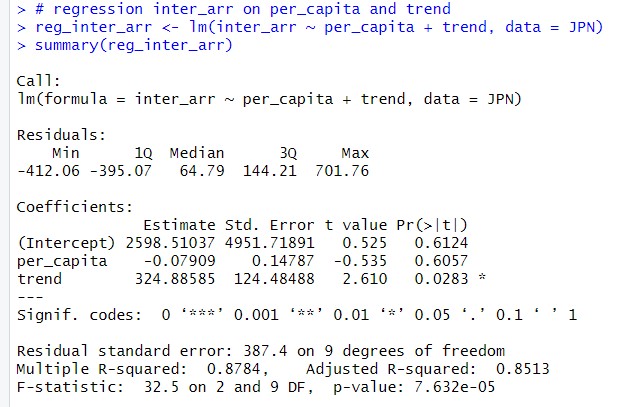
p-value is less than 0.05. So this model is not invalid. The coefficient of per_capita is -0.07909 and p-value is 0.6057. I can say per_capita is not significant for inter_arr.
The coefficient of trend is 324.88585 and p-value is 0.0283. So trend is statistically sgnificant. Each year increase 324 inter_arr.
Last, let's see inter_dep.
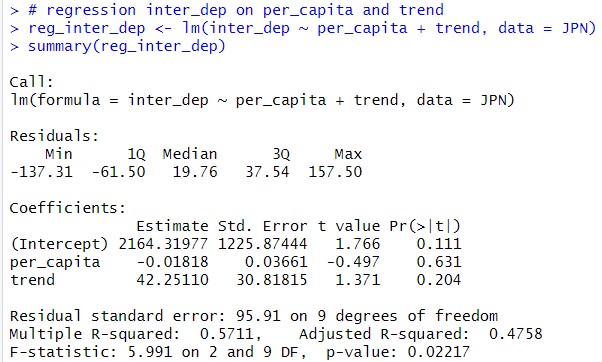
p-value is less than 0.05(0.02217) but per_capita p-value is 0.631. So I cannot say per_capita is statistically significant.
That's it. Thank you!
Next post is,
To read from the 1st post,