
Photo by V Srinivasan on Unsplash
This post is following of the above post.
In this post, let's do simple linaer regression anaysis using R.
First, I use df_country data frame.
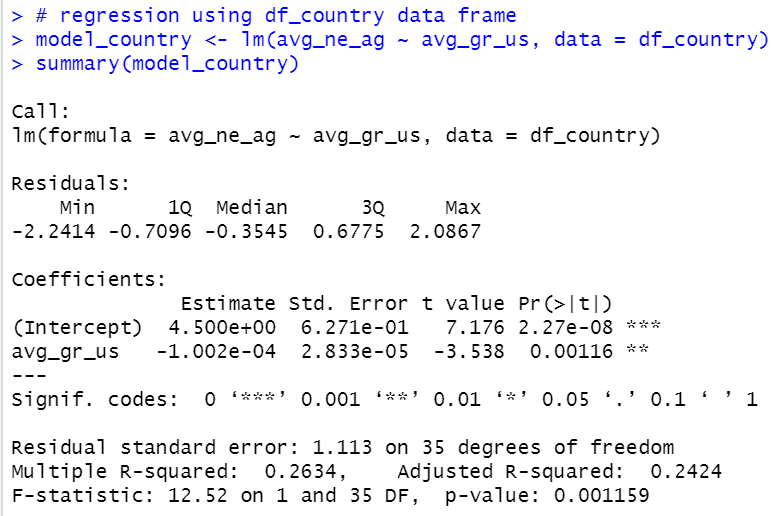
Coefficients of avg_gr_us is -1.002e-04, it is -0.000102.
So, if avg_gr_us incleased by 1 unit, avg_ne_ag would decrease by -0.000102.
it is a bit difficult to understance, so, I will multiply avg_gr_us by 10000.
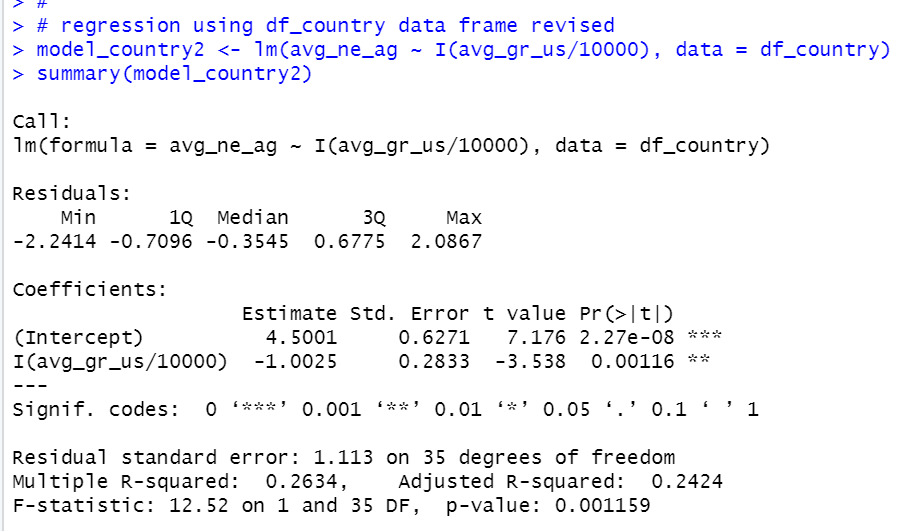
Now, coefficient of I(avg_gr_us/10000) is -1.0025 with standard error 0.2833.
Dgrees of 35. so 95% confidence interval of I(avg_gr_us) is
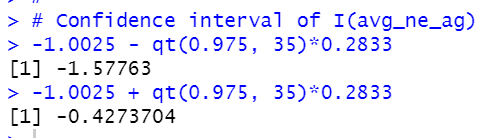
-1.58 ~ -0.427
Next, let's use country_year data frame.
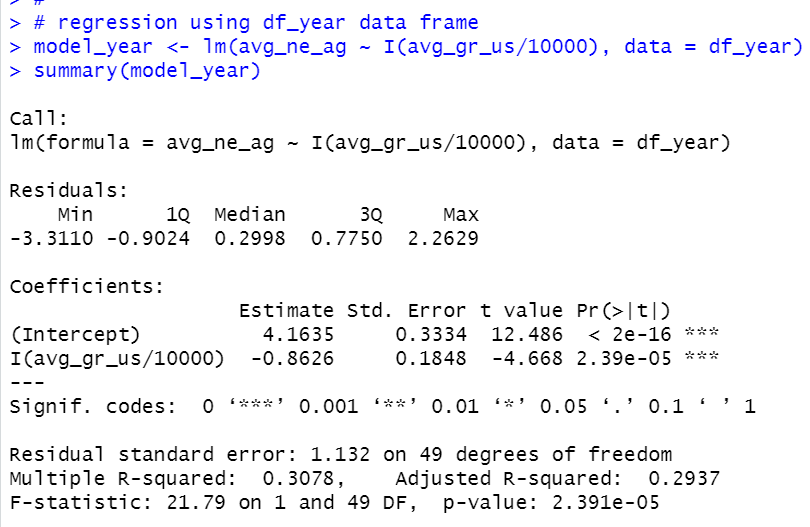
Coefficients of I(avg_gr_us/10000) is -0.8626. with standard error 0.1848 and degrees of freedom 49.
So, 95% confidence interval of I(avg_gr_us/10000) is
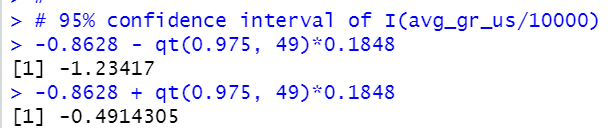
-1.23 to -0.491. This interval is within -1.58 ~ -0.427.
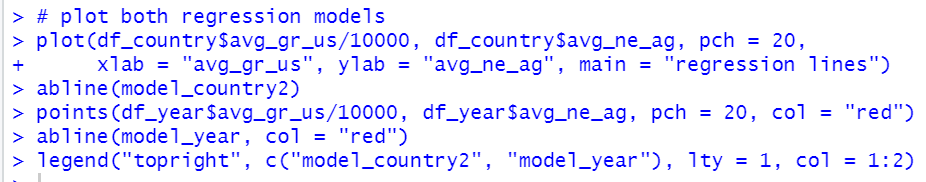
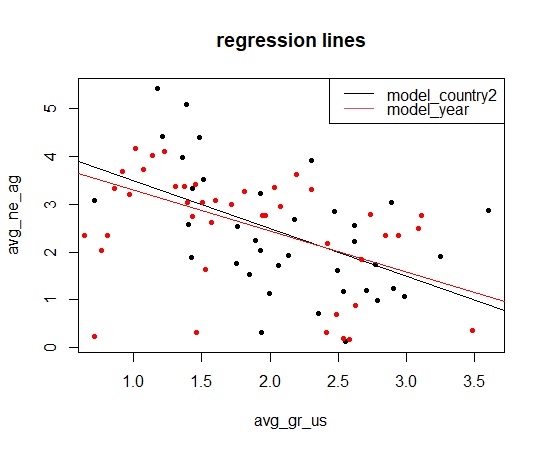
Next, let's make a schatter plot for these two models.
That' it. Thank you!
Next post is
To see the 1st post,